Exit Memo: Council of Economic Advisors
Eight Years of Recovery and Reinvestment
Chairman Jason Furman | January 5, 2017
Introduction
The Council of Economic Advisers (CEA) was established by the Employment Act of 1946 to provide the President with objective economic analysis and advice on the development and implementation of a wide range of domestic and international economic policy issues. The Council regularly advises the President on policies to spur economic growth and job creation, and evaluates the effects of these policies on the economy. CEA works closely with various government agencies, including the National Economic Council, the Domestic Policy Council, the Office of Management and Budget, White House senior staff, and other officials to engage in discussions on numerous policy matters. We also work to improve the public’s understanding of economic developments and of the Administration’s economic policies through our public output, including the annual Economic Report of the President.
Having worked on the President’s campaign, transition team, and White House staff from day one, I had a front row seat as the financial crisis unfolded. During those first, frightening months, I tracked the stock market’s path daily as it followed the same trajectory as it did during the outset of the Great Depression, and worked rapidly to help craft the Recovery Act as each month’s employment data showed hundreds of thousands of jobs lost. After that experience, I have remained especially vigilant about potential threats to the economy, whether from Congressional brinkmanship over shutting down the Federal Government or defaulting on the debt, or from foreign threats like the euro area crisis. While these potential stumbling blocks, and longer-term economic challenges, remain, I have been deeply proud to see the recovery strengthen over the years and to pass the baton to the next Administration with an unemployment rate below 5 percent, the economy growing strongly, consumer confidence at its highest point in nearly a decade, a safer, more stable financial system, and a broadly positive economic outlook in the coming years.
In early 2009, President Obama was faced with the daunting task of helping to rescue an economy in the midst of its worst crisis since the Great Depression—an effort that relied on a wide range of policies developed by a team across the Federal Government, including CEA. The forceful response to the crisis in 2008 and 2009 helped stave off a potential second Depression, setting the U.S. economy on track to rebuild, reinvest, and recover. Recovery from the crisis alone, though, was never our sole aim. The Administration has also addressed the structural barriers to shared, sustainable prosperity that middle-class families had faced for decades—rising health care costs, limited access to higher education, slow growth in incomes, high levels of inequality, a reliance on oil and other sources of carbon pollution, and more—so that the U.S. economy would work for all Americans. Thanks to these policy efforts, eight years later, the American economy is stronger, more resilient, and better positioned for the 21st century than ever before.
The Crisis and the Recovery
After eight years of recovery, it is easy to forget how close the U.S. economy came to an outright depression during the crisis. Indeed, by a number of macroeconomic measures—including household wealth, employment, and trade flows—the first year of the Great Recession in the United States saw declines that were as large as or larger than at the outset of the Great Depression in 1929-30. However, the forceful policy response by the Federal Government—including the American Recovery and Reinvestment Act (ARRA), the rescue of the auto industry, and actions to stabilize and reform the financial sector—combined with the resilience of American businesses and families and coordination with our international partners to help stave off a second Great Depression. Across a broad range of macroeconomic measures, the U.S. economy has made remarkable progress in the eight years since one of the most tumultuous and uncertain periods in its history.
The Great Recession was well underway when President Obama took office in January 2009. In that month, the unemployment rate stood at 7.8 percent, already elevated from its average in the 2001-07 expansion period. The unemployment rate would continue to increase until it peaked at 10.0 percent in October 2009. In the first quarter of 2009 alone, total job losses averaged 772,000 a month, larger than the populations of a number of U.S. States.
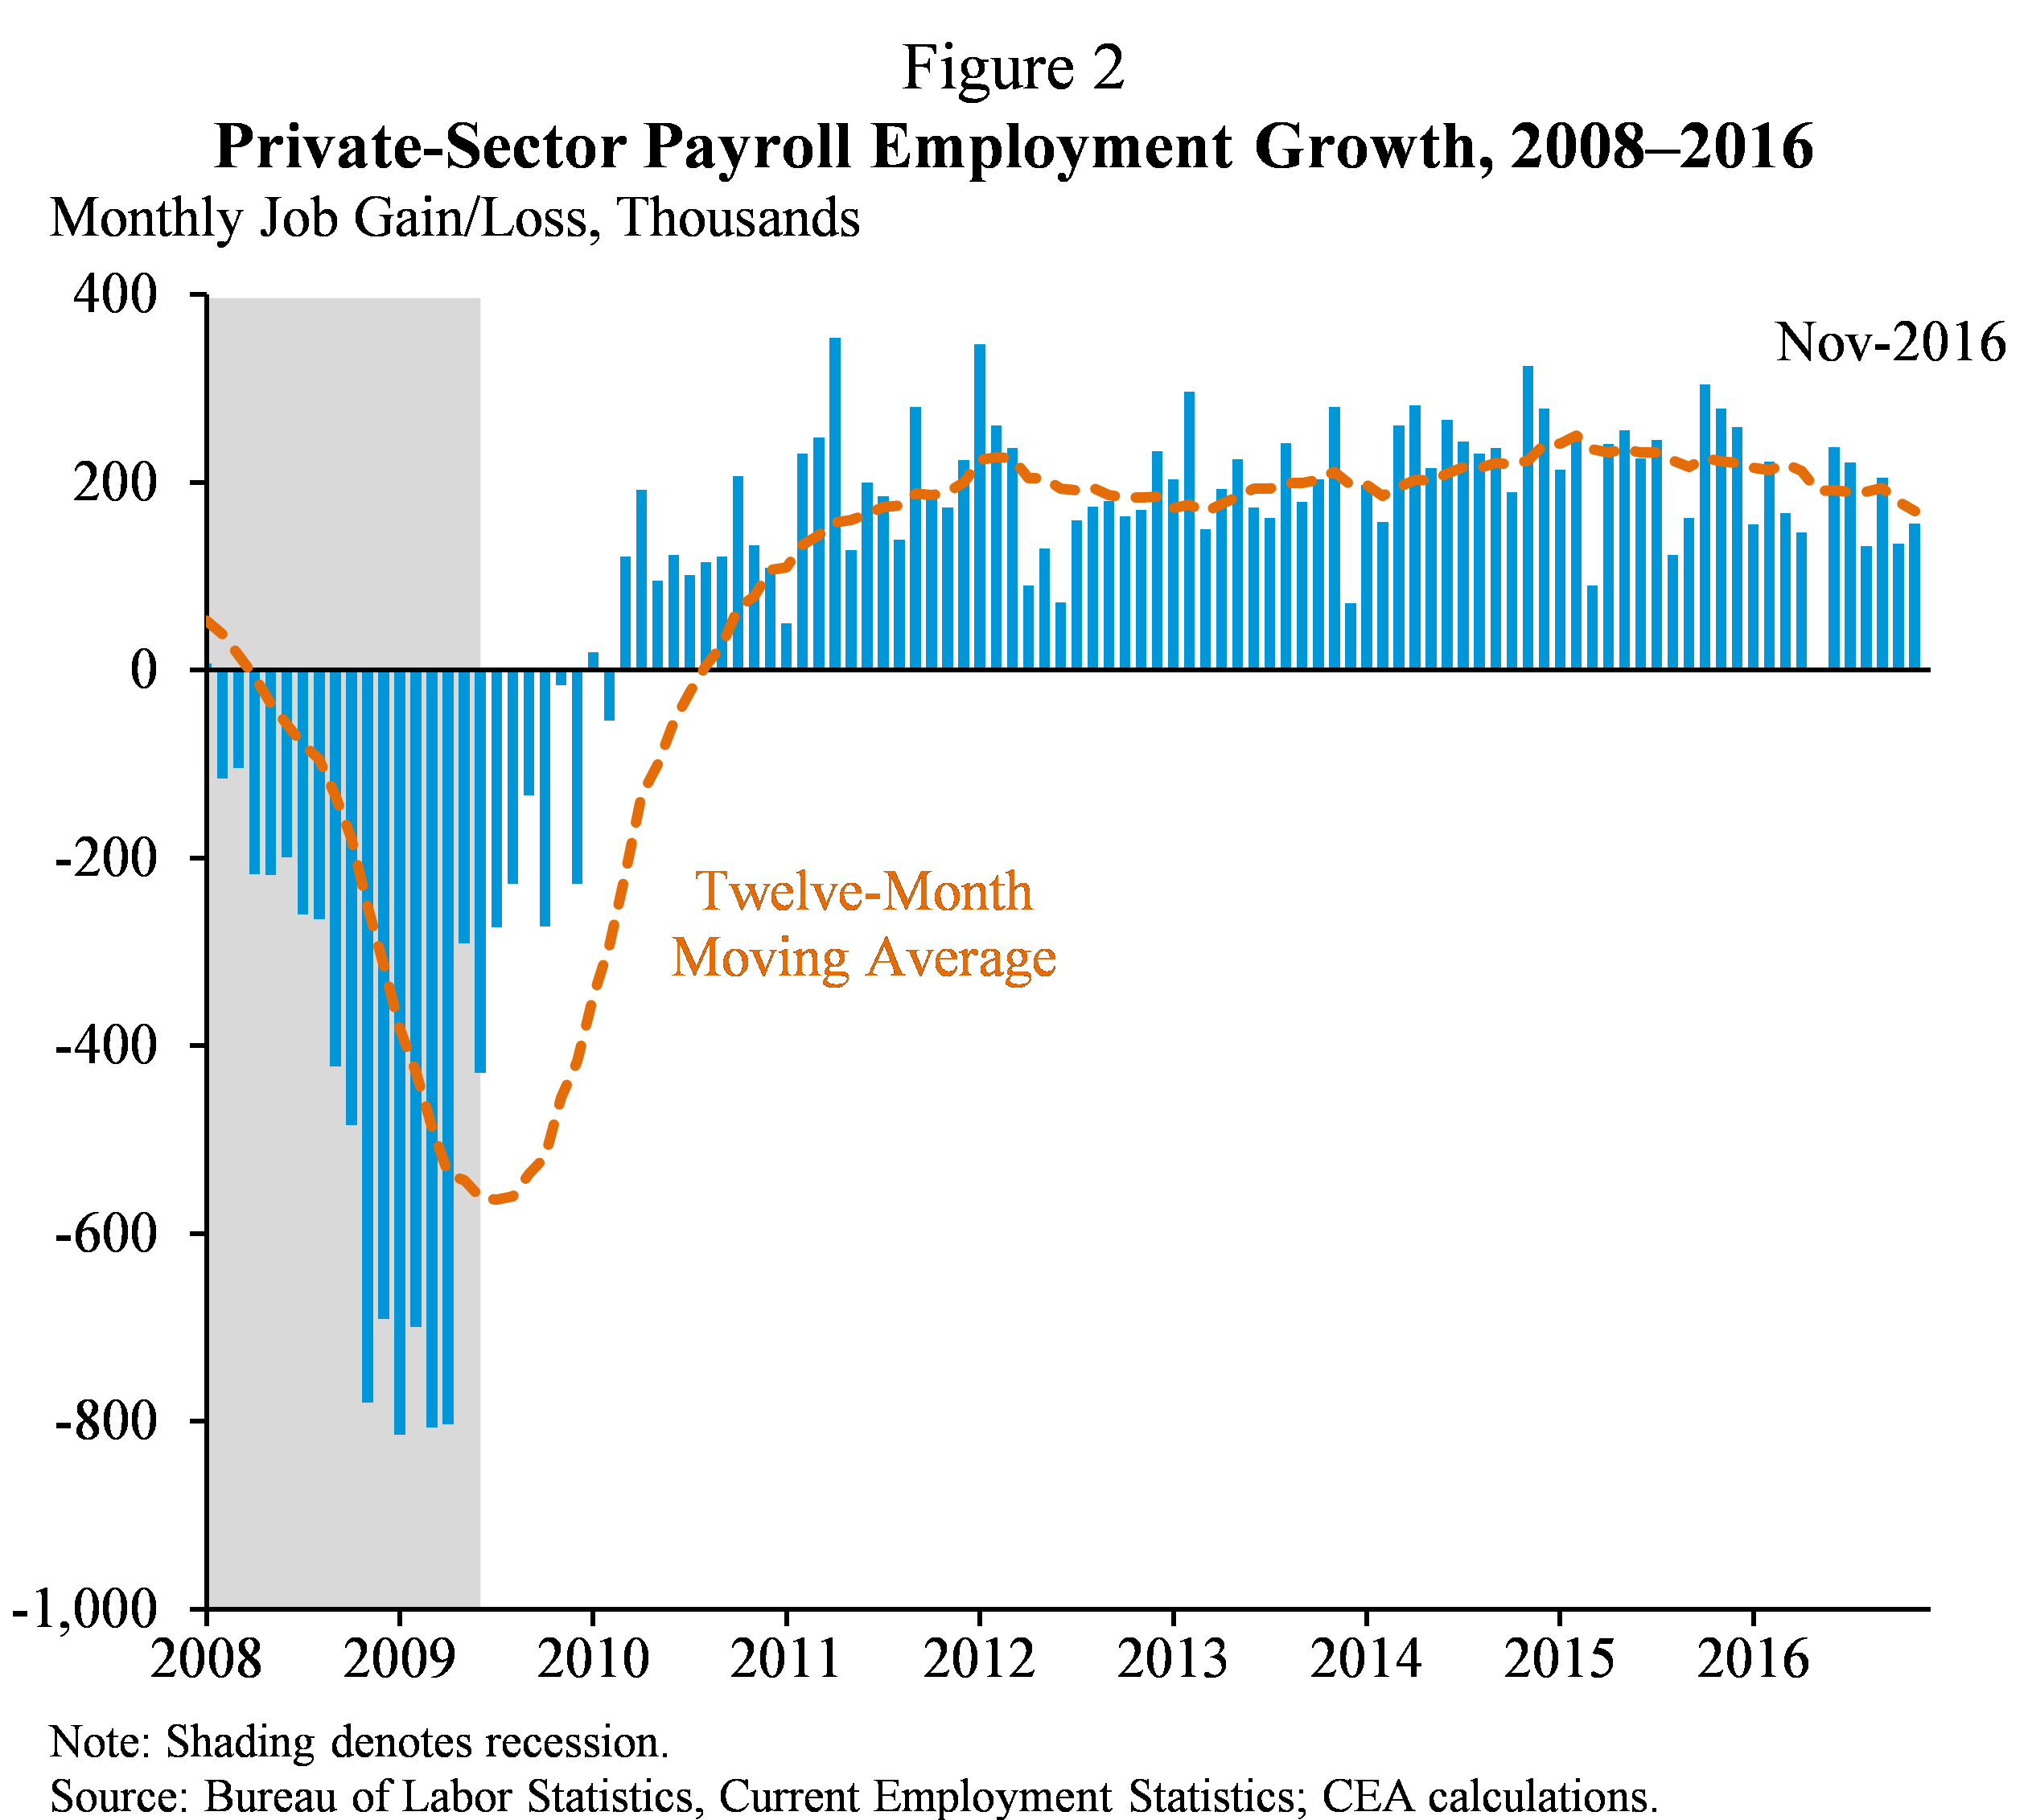
From its peak, the unemployment rate recovered to its pre-recession average in mid-2015 and continued to fall, standing at 4.6 percent as of November 2016. This rapid decline came far more quickly than most economists predicted: as recently as March 2014, private forecasters expected the unemployment rate to remain above 5.0 percent until at least 2020 (Figure 1). Meanwhile, the labor force participation rate, which has been subject to downward pressure due to the aging of the U.S. population, has been broadly stable since the end of 2013, as the strengthening labor market recovery has led workers to enter (or reenter) the workforce, offsetting downward pressure from demographic trends.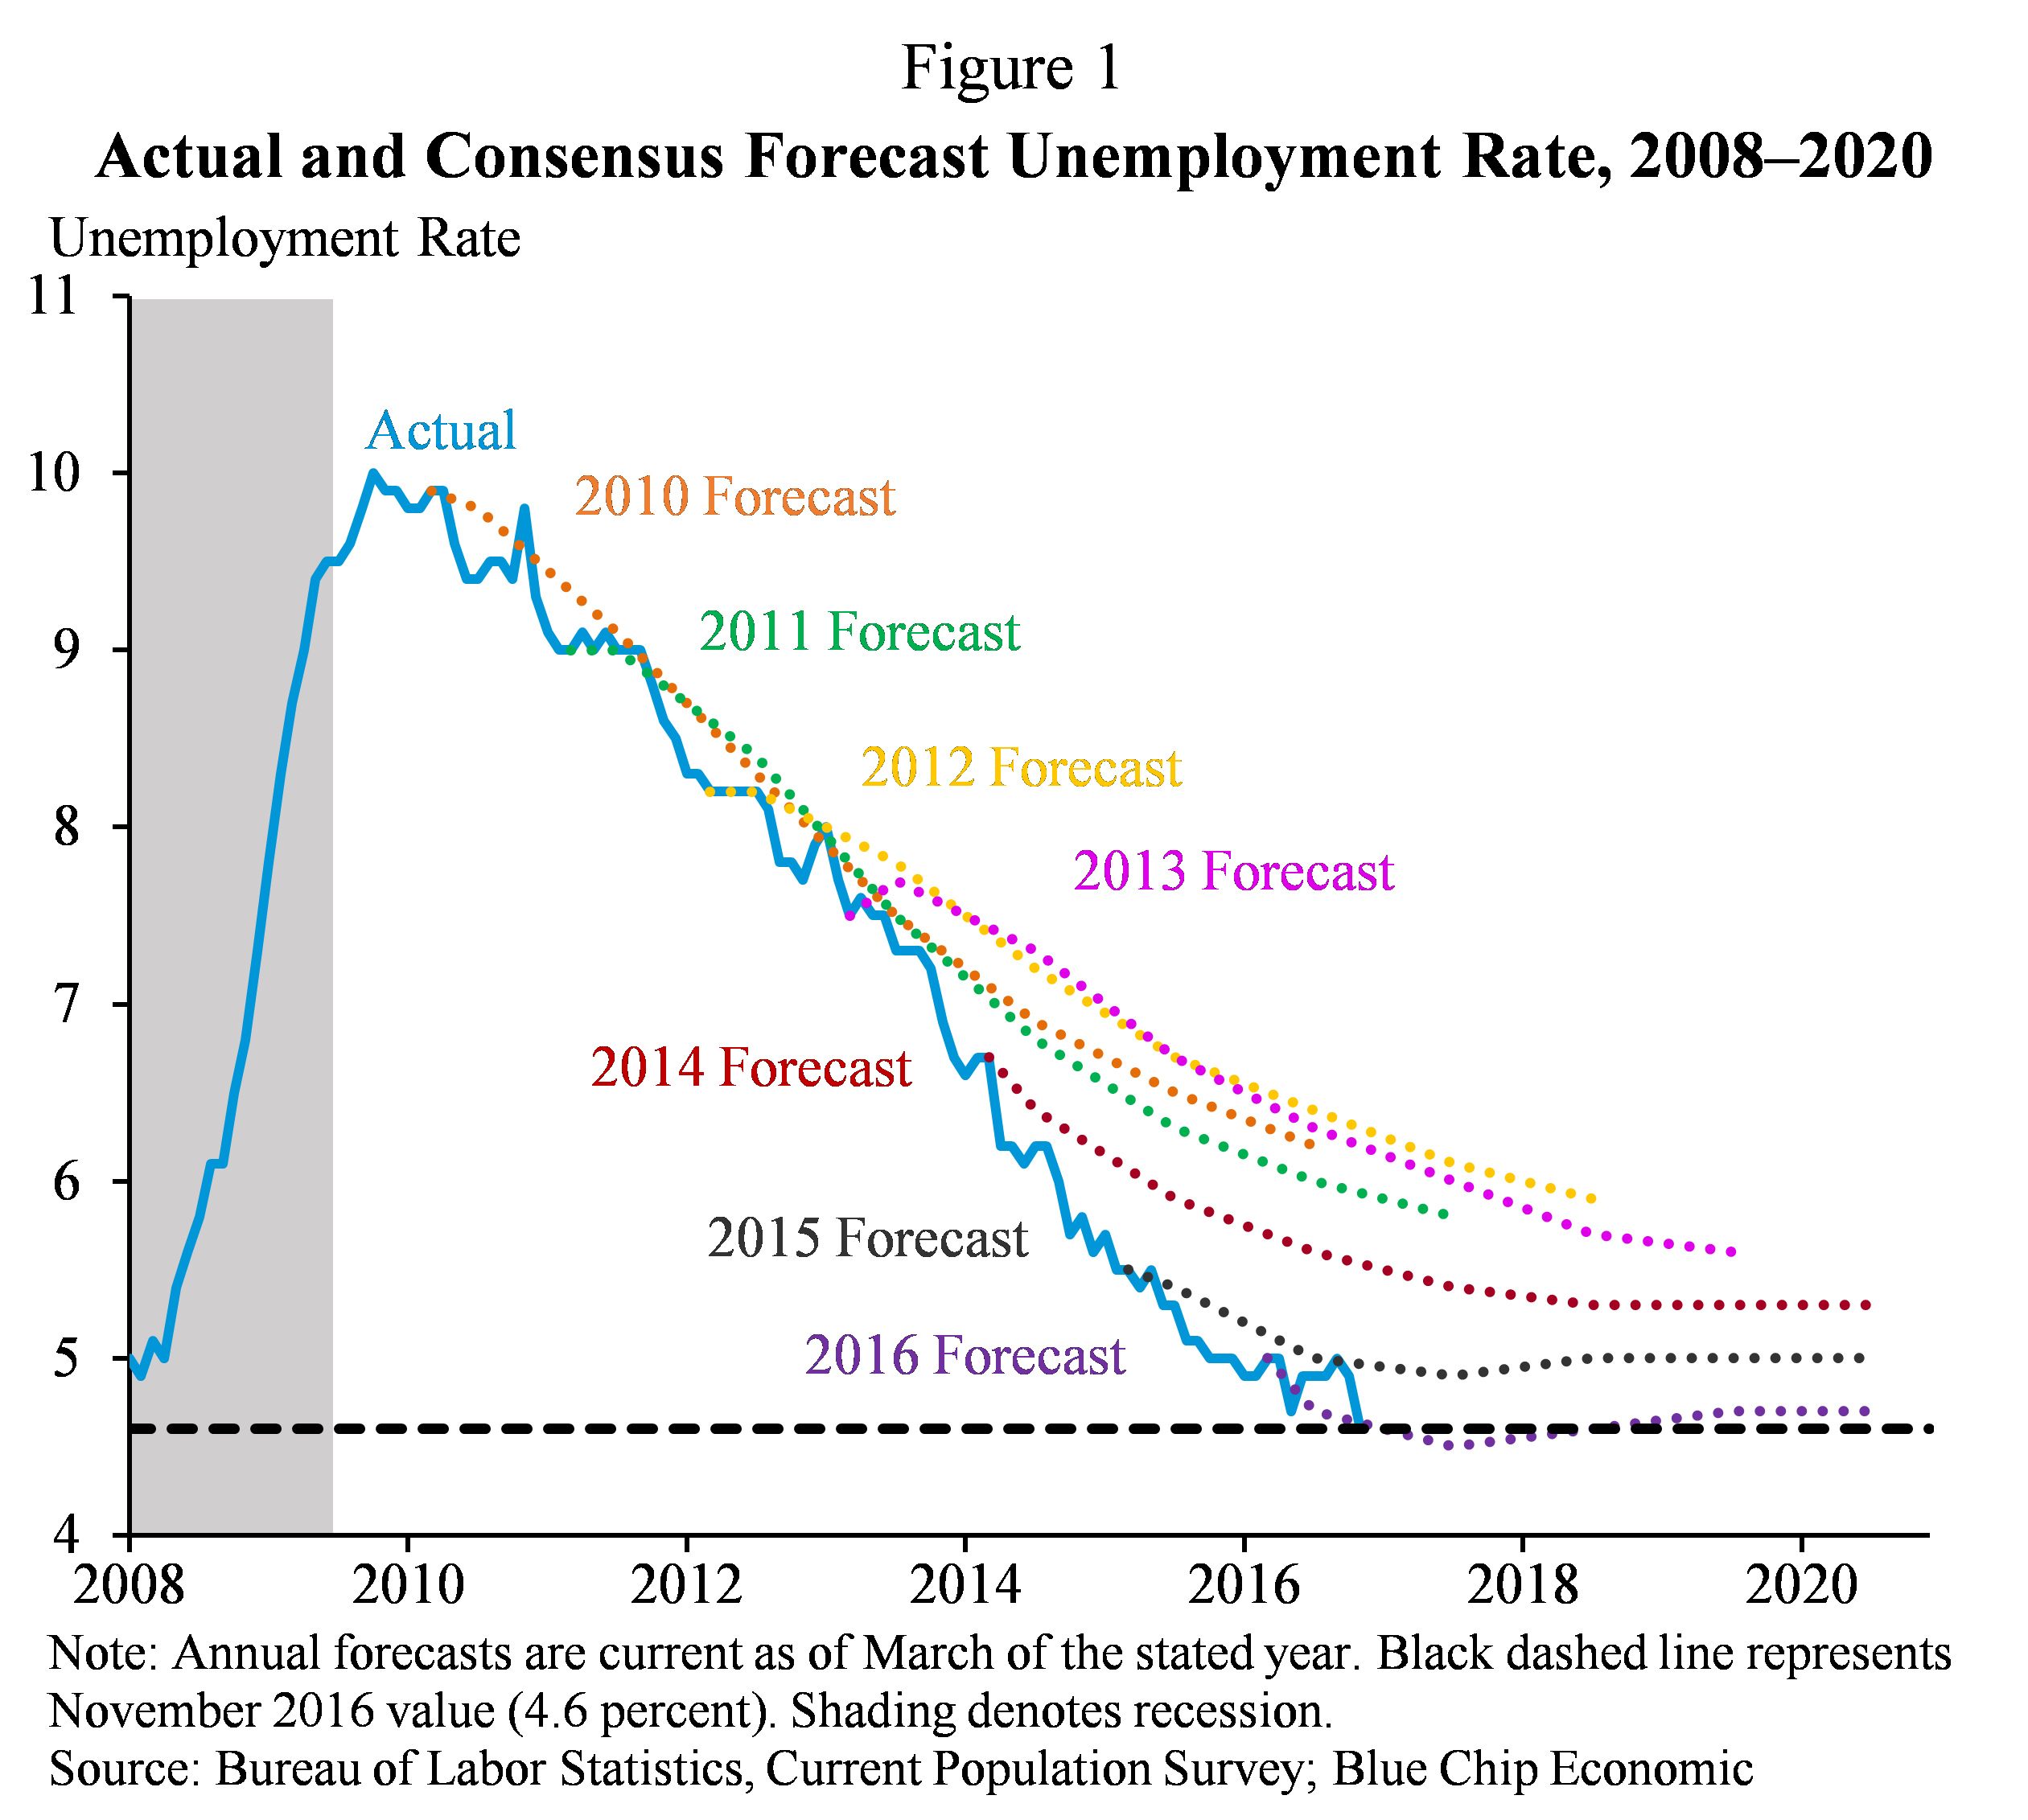 The U.S. economy has added jobs for 74 straight months, the longest streak of total job growth on record. Total nonfarm employment recovered to its pre-recession peak in 2014—the best year for job creation since the 1990s—and, as of November 2016, exceeded its pre-recession peak by 6.7 million jobs. Since private-sector job growth turned positive in March 2010, U.S. businesses have added 15.6 million jobs (Figure 2). The manufacturing sector has added over 800,000 jobs since February 2010, the industry’s fastest growth since the 1990s. And since June 2009, when Chrysler and General Motors emerged from bankruptcy, the automobile industry (manufacturing and retail) has added nearly 700,000 jobs, the industry’s strongest growth on record.
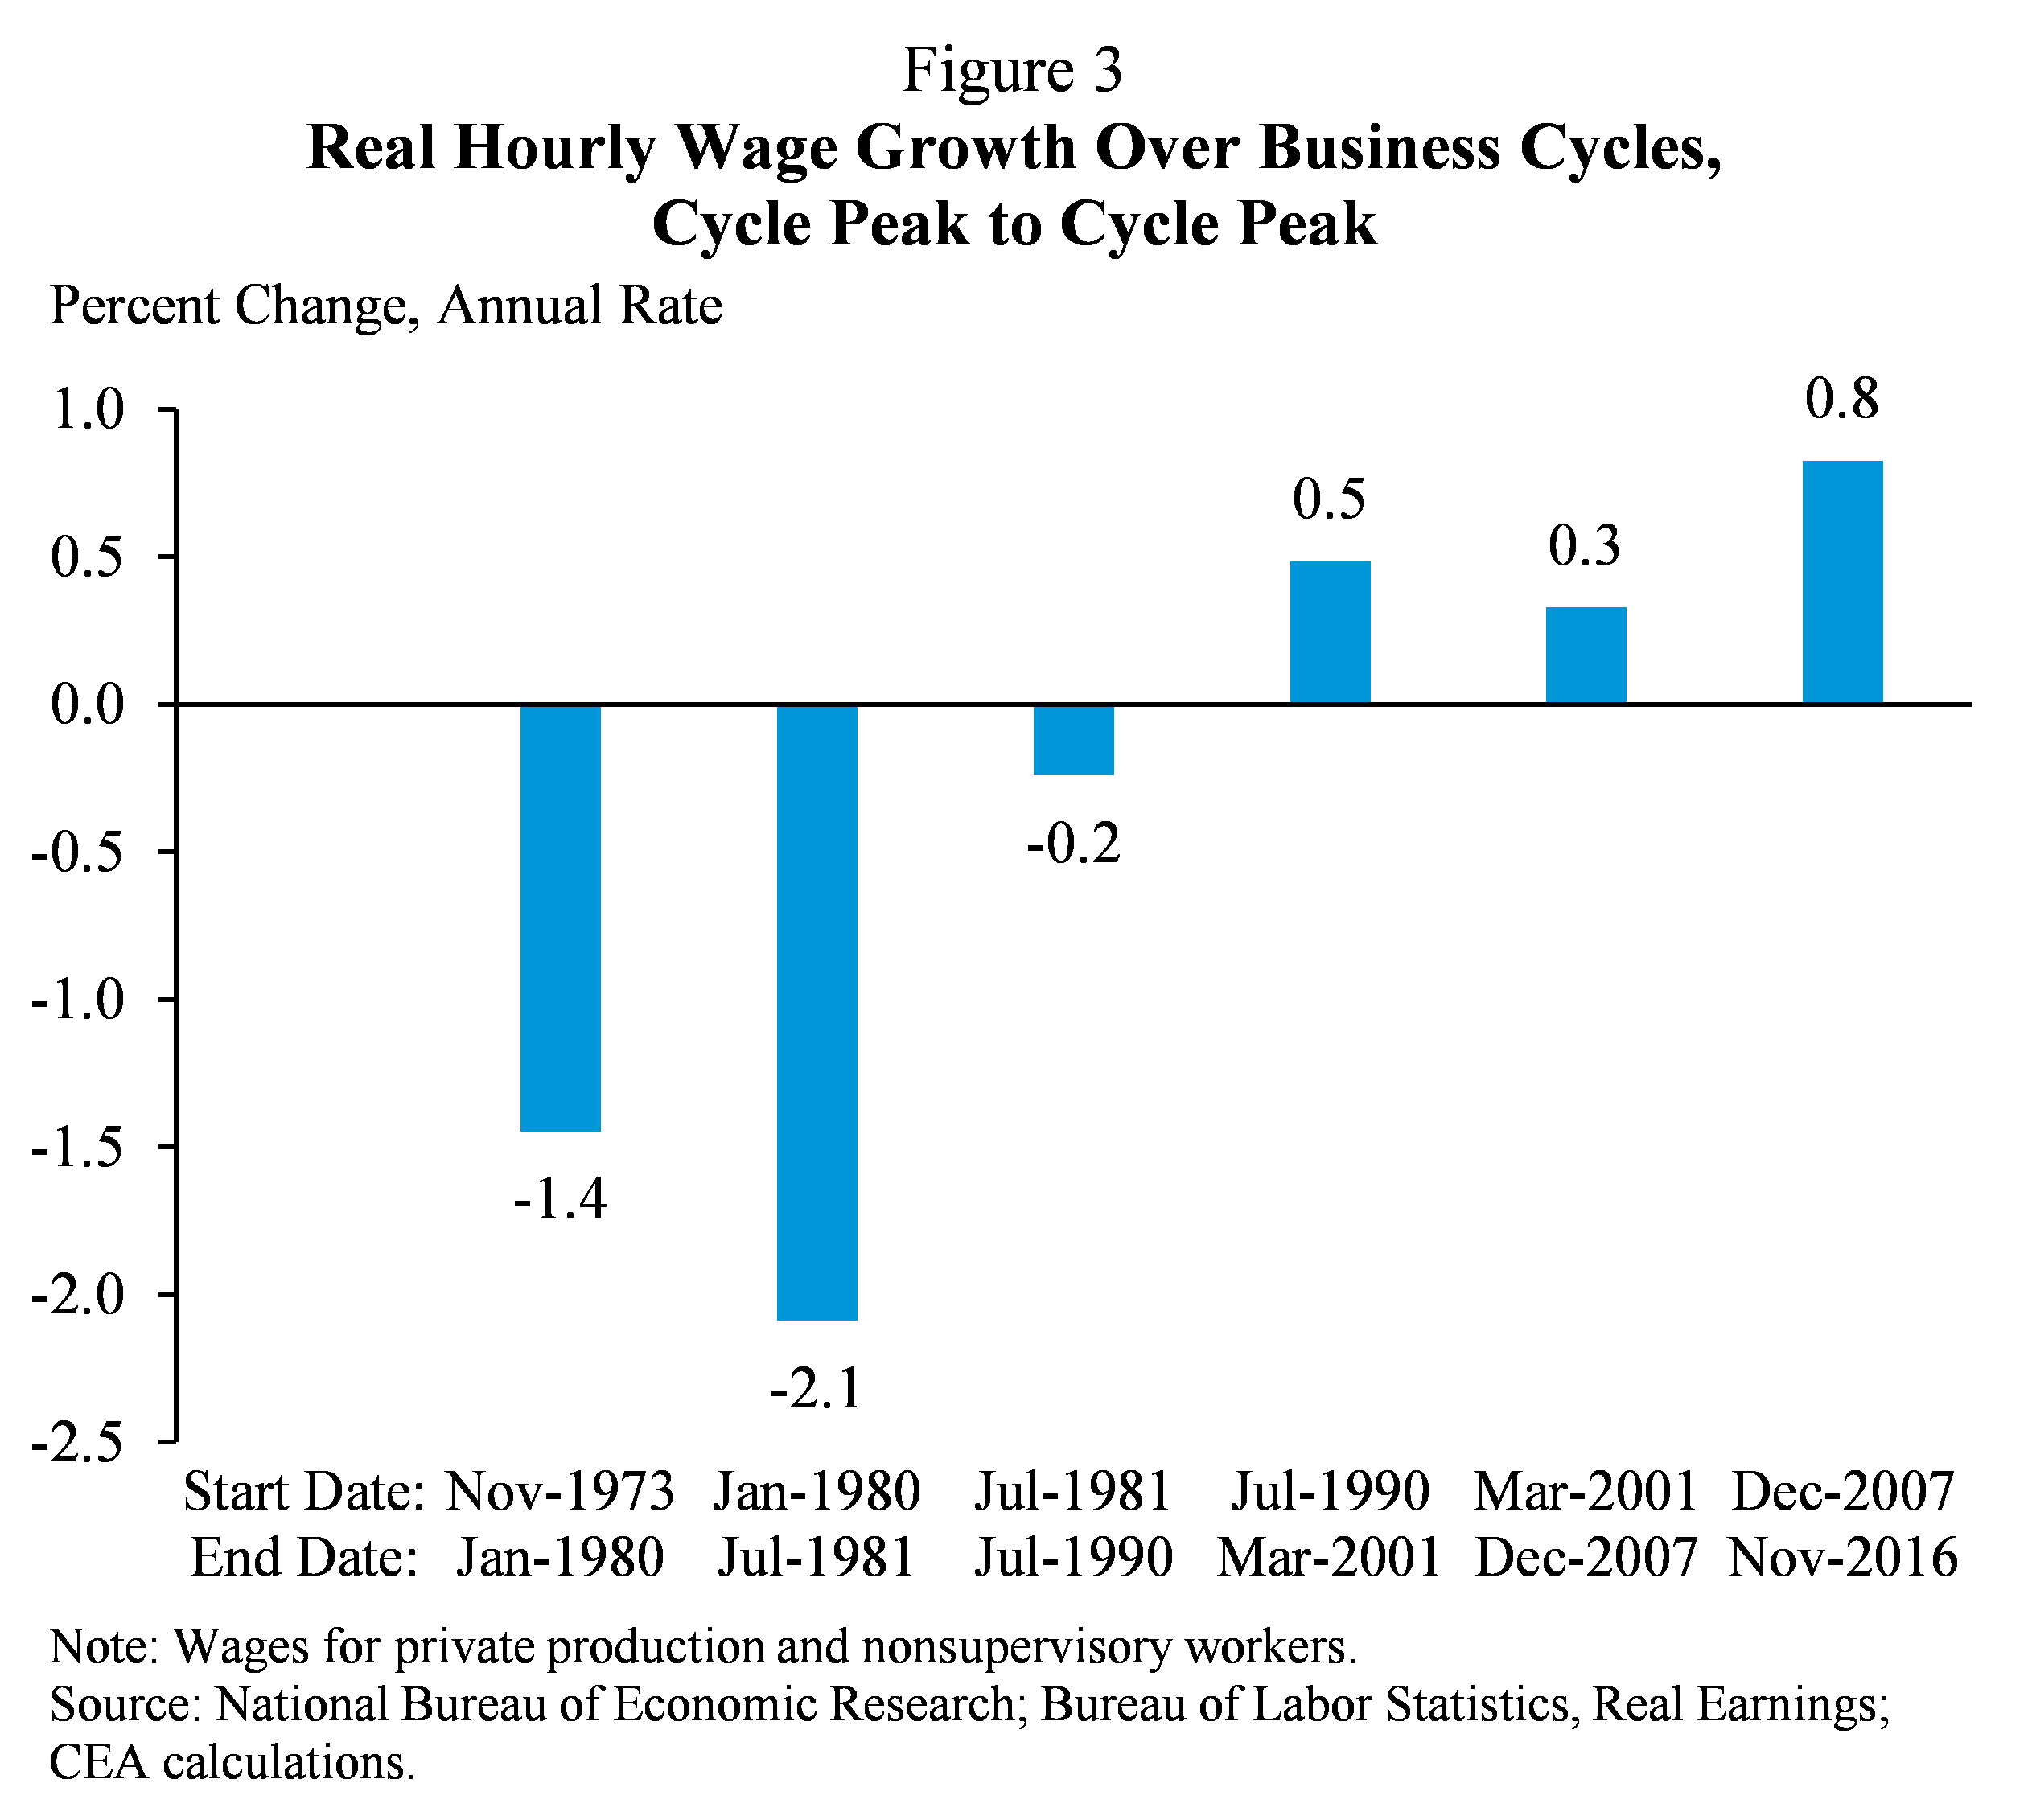
As the labor market has strengthened, the recovery has translated into real wage gains for workers. Due to both an acceleration in nominal wage growth and low inflation, since the end of 2012 workers have seen a larger increase in real wages than they did over the entire period from 1980 to 2007. Overall, real hourly wage growth since the business cycle peak in December 2007 has averaged 0.8 percent a year, the fastest growth of any business cycle (measured peak-to-peak) since the 1970s (Figure 3).
The combination of robust employment growth and accelerating real wage growth has translated into strong growth in household incomes. From 2014 to 2015, real median household income grew 5.2 percent, or $2,800, the fastest growth on record. Moreover, these income gains have been widely shared: households at the bottom and middle of the income distribution saw faster real income gains from 2014 to 2015 than did households at the top of the income distribution. Meanwhile, the poverty rate saw its sharpest reduction since the 1960s in 2015, with 3.5 million Americans, including 1 million children, lifted out of poverty.
Other indicators at the end of 2016 also show substantial progress. As of the third quarter of 2016, the U.S. economy was 11.6 percent larger than at its peak before the crisis. Real, or inflation-adjusted, household net worth exceeds its pre-recession peak by 16 percent. Rising home prices have helped bring millions of homeowners back from negative equity, and foreclosure rates are back to pre-crisis levels. Since the Affordable Care Act (ACA) was signed into law in 2010, health care prices have risen at the slowest pace in 50 years. Since 2008, the United States has tripled the amount of energy harnessed from wind and has increased solar generation thirtyfold. Today, the United States is less reliant on foreign oil than it has been in nearly three decades. Even as the economy has grown, carbon dioxide emissions from the energy sector fell by 9.5 percent from 2008 to 2015, and in the first half months of 2016, were at their lowest level in 25 years. Capital ratios for the largest U.S. banks have increased 2.6 times since 2009, increasing their safety and soundness. The Federal budget deficit in fiscal year (FY) 2016 was 3.2 percent of GDP, about a third of the 9.8 percent of GDP deficit recorded in 2009 and equal to the average over the last 40 years.
Promoting Stronger, More Inclusive, and More Sustainable Economic Growth
The response of the Federal Government to the crisis averted a sharper and more prolonged downturn and put the U.S. economy back on a path to growth. Even so, a number of decades-long trends that preceded the crisis—rising inequality, insufficient health insurance coverage, high health care costs, and growing costs for higher education—still remained, preventing middle-class Americans from seeing gains in their incomes, economic security, and standards of living. Addressing these barriers to inclusive growth has been the cornerstone of the Obama Administration’s economic policy, which has been focused not only on returning the U.S. economy back to stability, but on setting it on a firmer path to sustained growth that is broadly shared among all American families. The following includes some, but certainly not all, of the Administration’s efforts in this regard.
Reducing Inequality
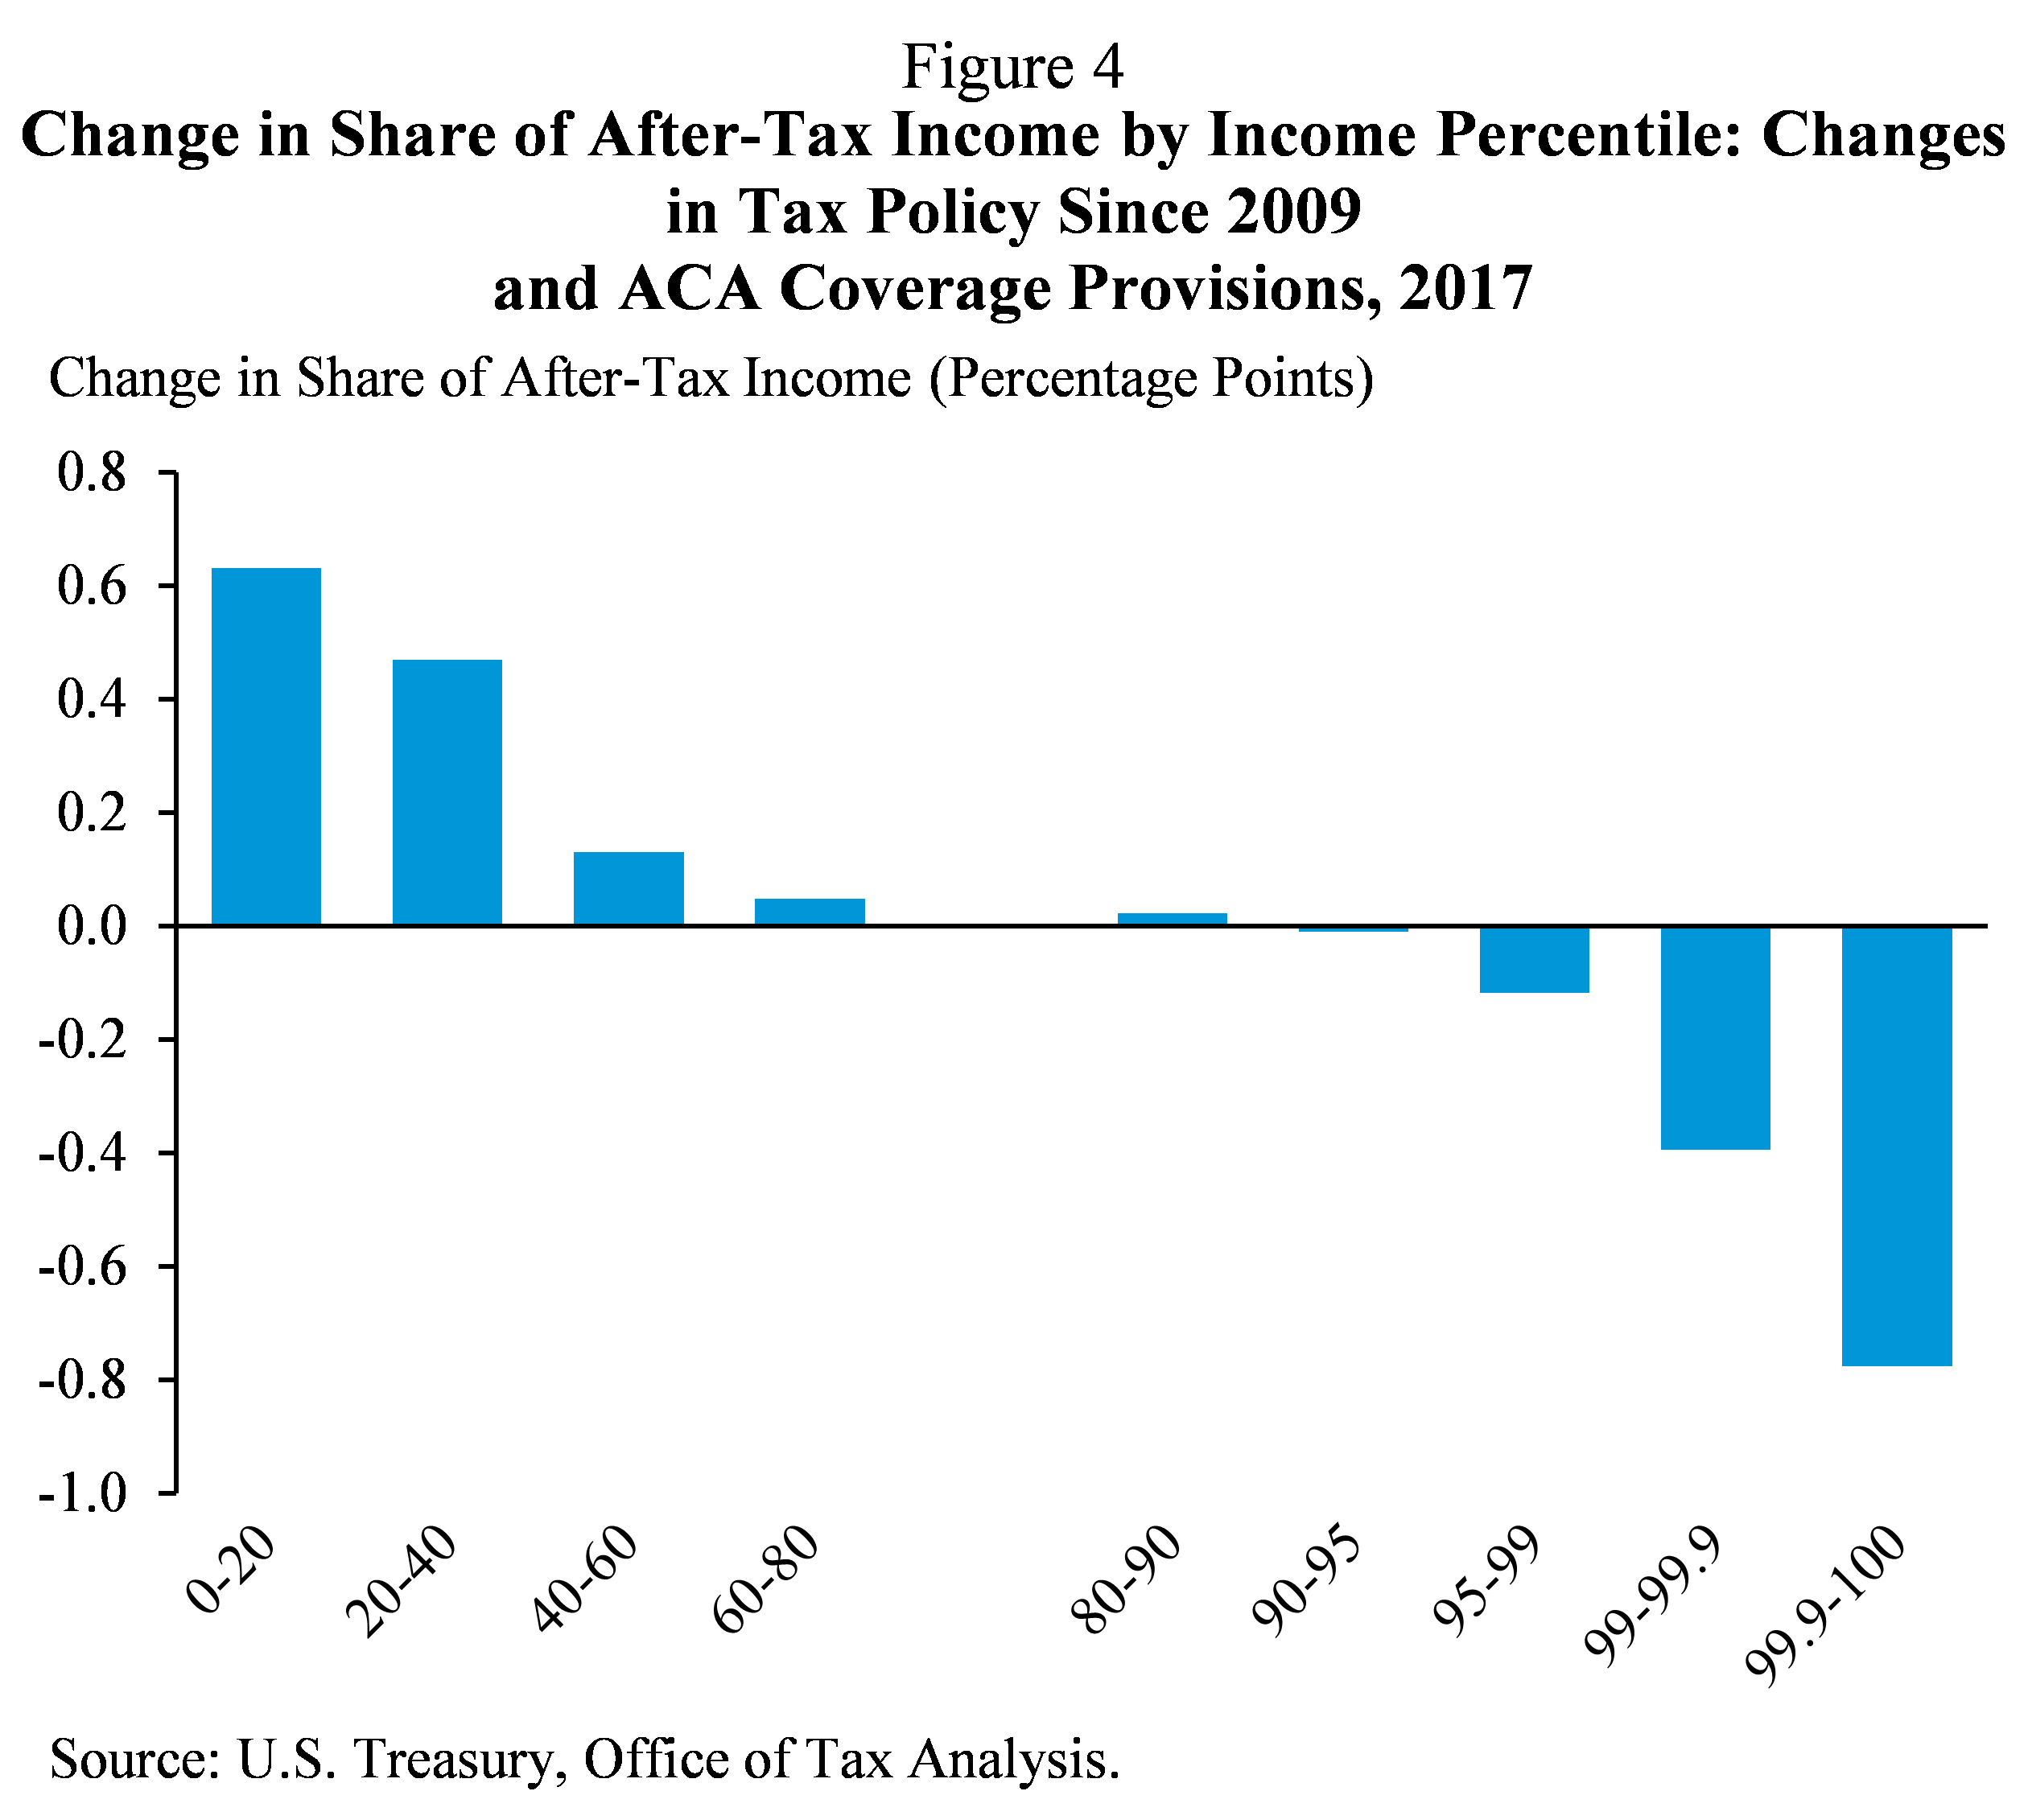
The legislation President Obama fought for and signed into law represents a historic accomplishment in reducing inequality. Together, changes in tax policy and the ACA coverage provisions will increase the share of after-tax income received by the bottom quintile of households in 2017 by 0.6 percentage point, or 18 percent—equivalent to more than a decade of average income gains—and the share received by the second quintile by 0.5 percentage point, or 6 percent. At the same time, they will reduce the share received by the top 1 percent by 1.2 percentage points, or 7 percent (Figure 4). These changes will increase average tax rates for the top 0.1 percent of families, a group projected to have average pre-tax incomes over $8 million, by nearly 7 percentage points. Tax changes enacted since 2009 have boosted the share of after-tax income received by the bottom 99 percent of families by more than the tax changes of any previous administration since at least 1960, and President Obama has overseen the largest increase in Federal investment to reduce inequality since the Great Society programs of the Johnson Administration.
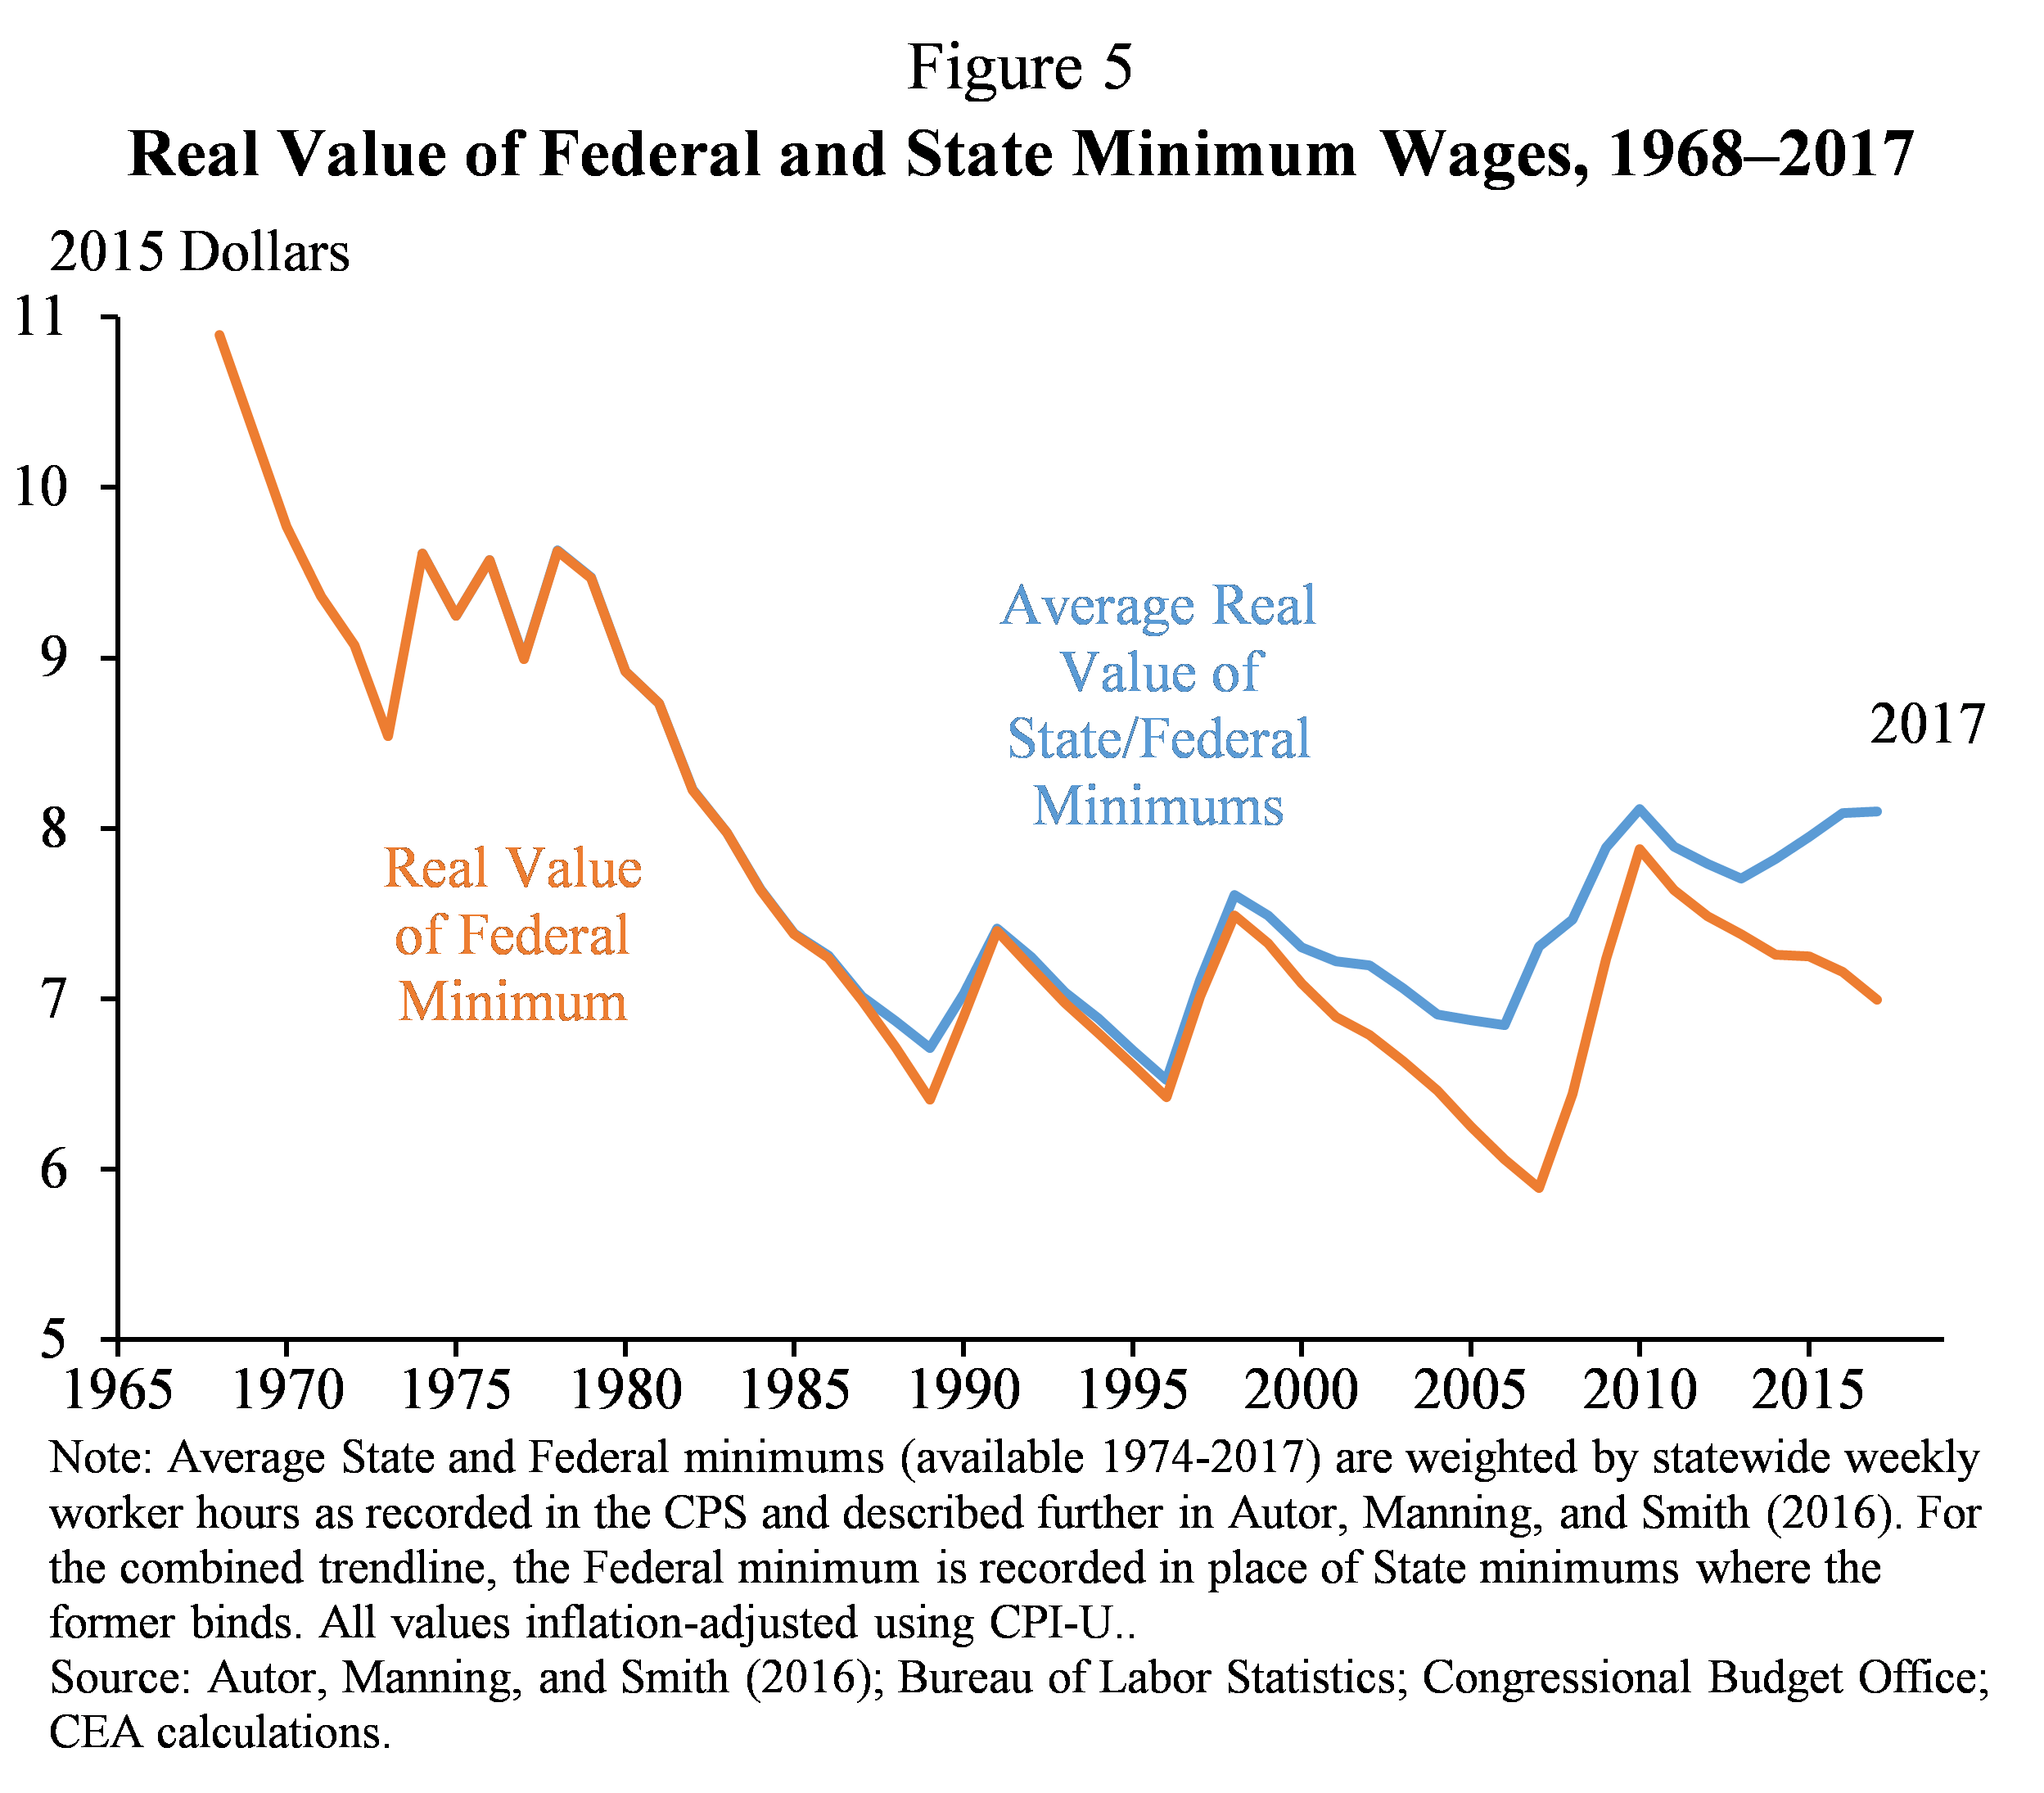
At the same time, too many Americans continue to work for wages that are too low, and the real value of the minimum wage has been eroded over the past five decades. President Obama called for increasing the Federal minimum wage in his 2013 State of the Union address, and while Congress failed to act, 18 States, the District of Columbia and more than 50 communities have enacted legislation raising their minimum wages since that time. In part due to these increases, the decline in the average value of the effective minimum wage has been reversed, and the average effective minimum wage has now reached roughly the same inflation-adjusted value it had in 2009, when the Federal minimum was last increased (Figure 5). To build on this progress, it is long past time for Congress to take action to increase the Federal minimum wage.
Reforming the Health Care System
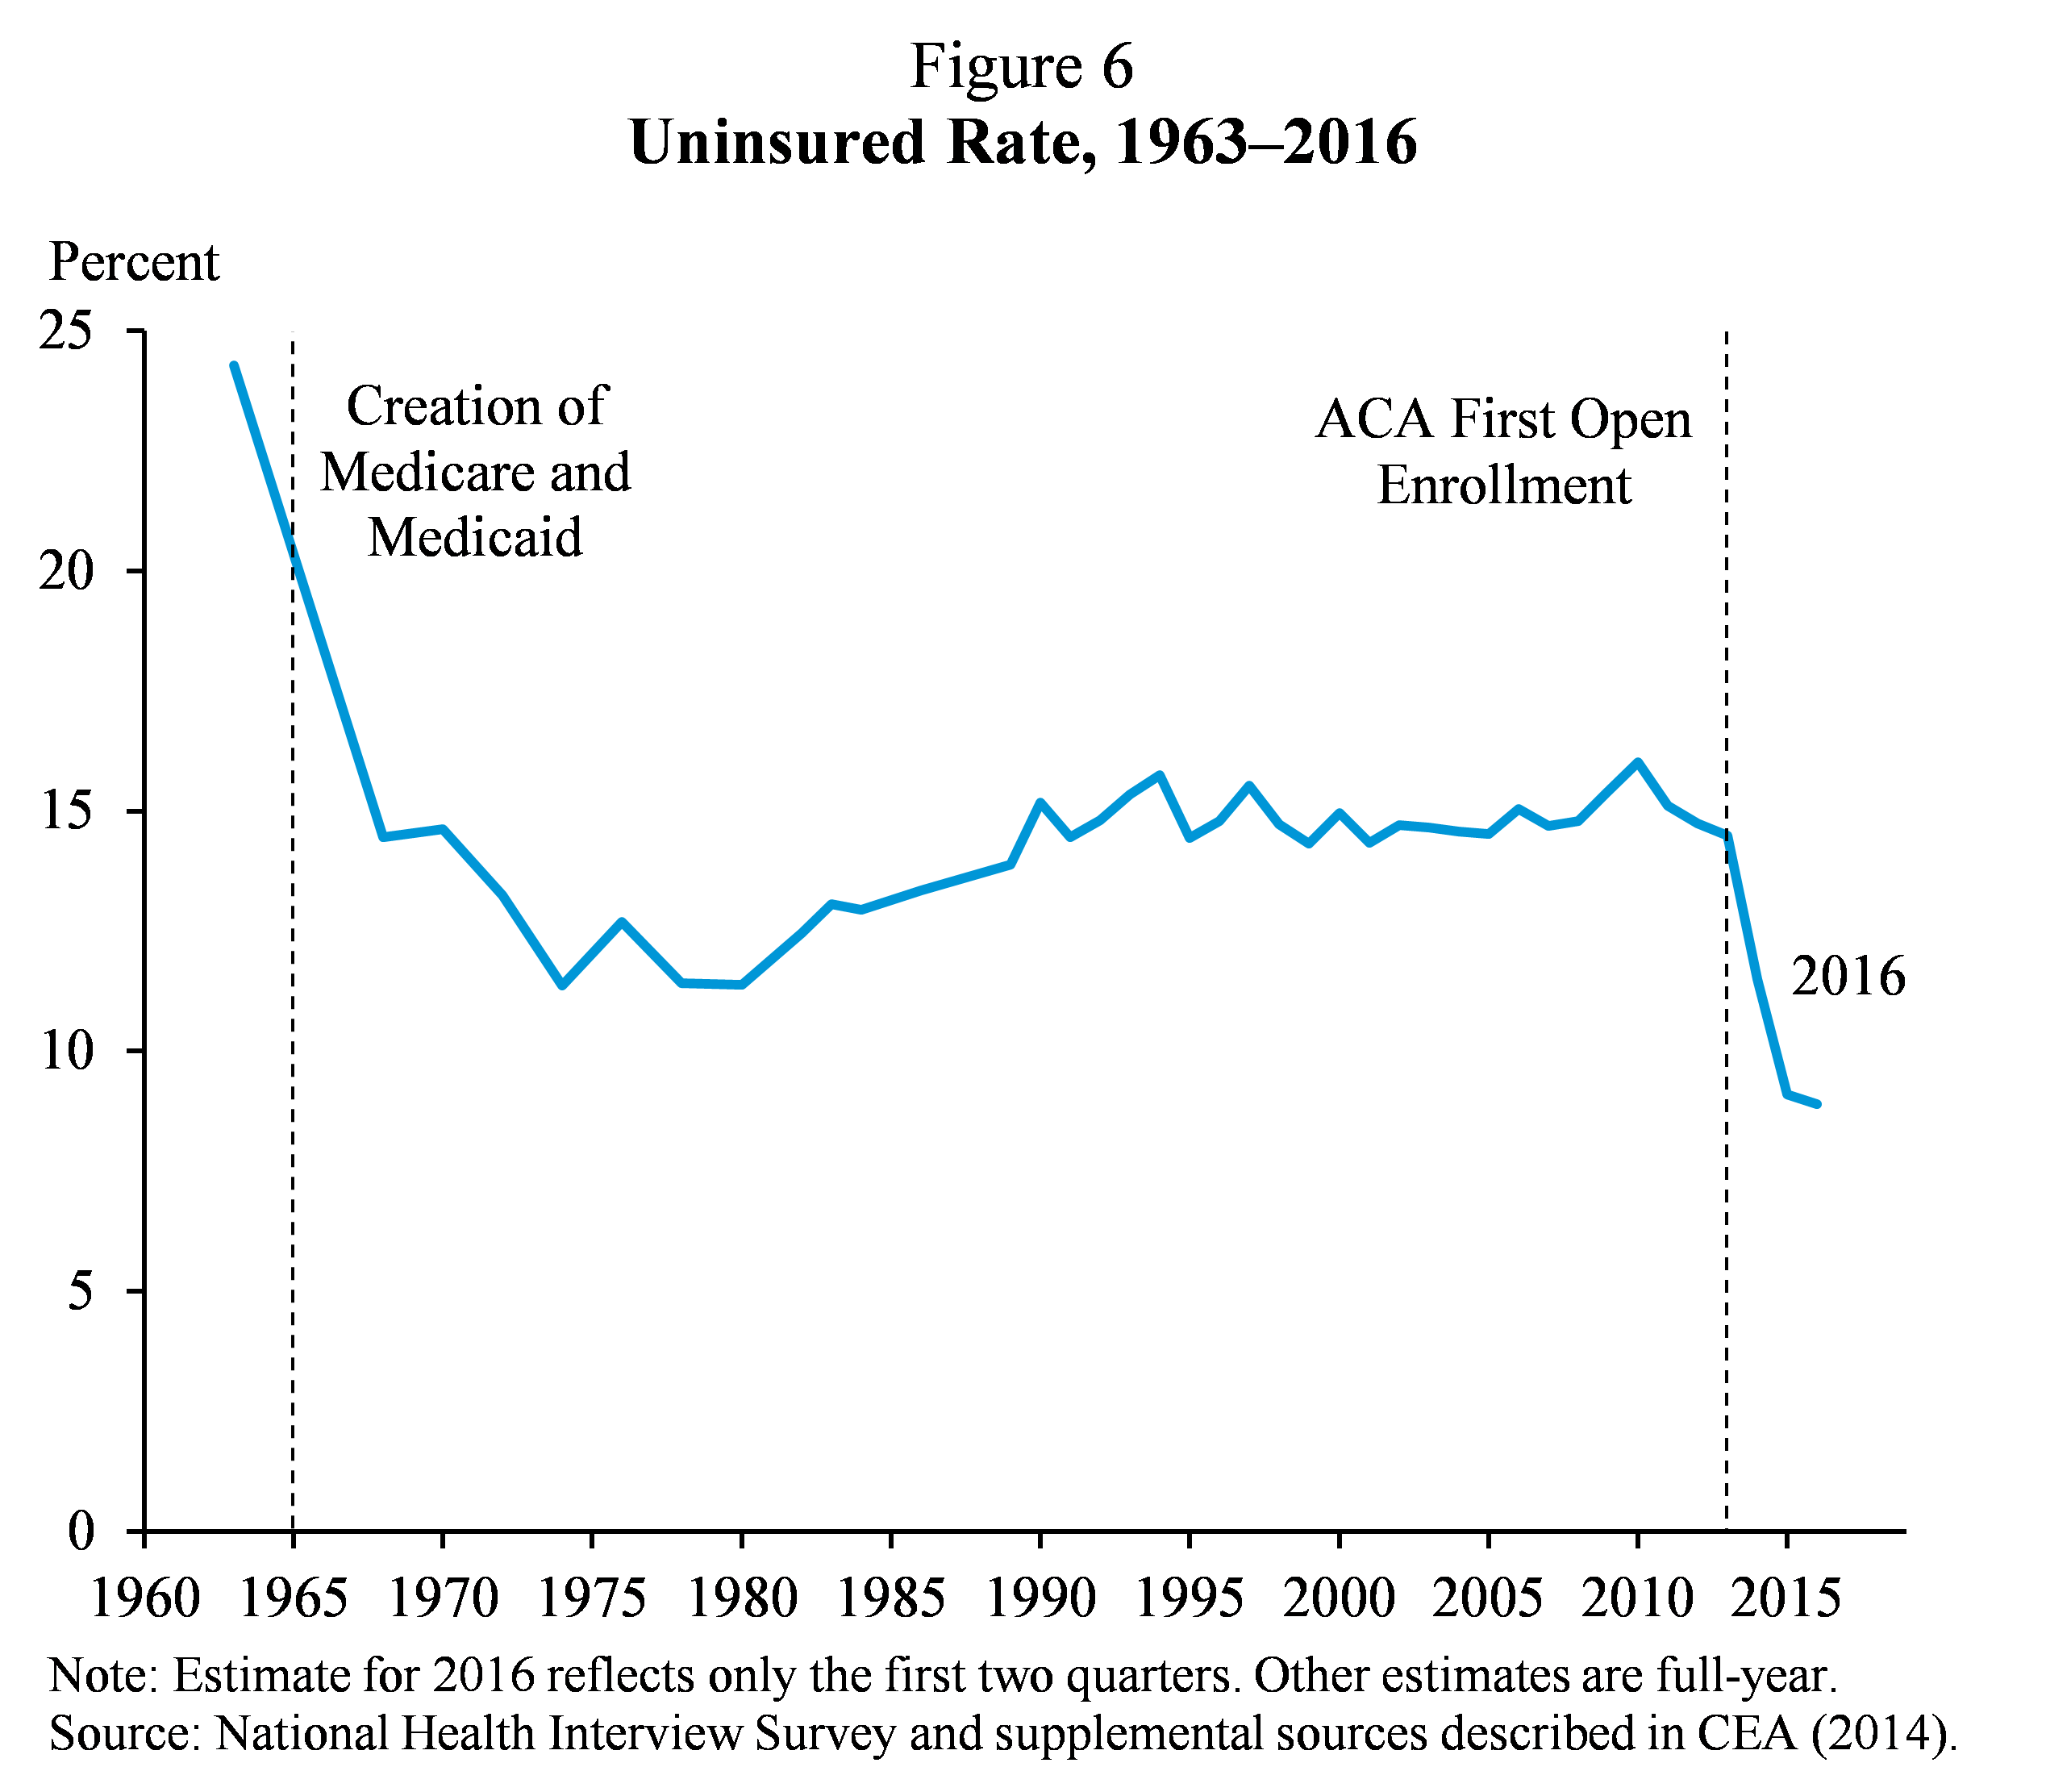
The Administration has made dramatic progress in ensuring that all Americans have access to affordable, high-quality health care by expanding and improving health insurance coverage and reforming the health care delivery system. In February 2010, the President signed into law the ACA, which reformed the individual health insurance market to ensure that all Americans, including people with pre-existing health conditions, could find affordable, high-quality coverage; provided generous financial support to States that expand their Medicaid programs to cover more low-income Americans; and allowed young adults to remain on a parent’s plan until age 26, among other reforms. Because of the ACA, an estimated 20 million additional adults now have health insurance, and as of 2016, the uninsured rate stands at its lowest level ever (Figure 6). Evidence demonstrates that broader insurance coverage is improving access to care, health, and financial security for the newly insured, while reducing the burden of uncompensated care for the health care system as a whole, without the adverse effects on the labor market that critics of the ACA had predicted. Meanwhile, prices of health care goods and services have grown at a slower rate under the ACA than during any comparable period since these data began in 1959, and recent years have also seen exceptionally slow growth in per-enrollee spending in both public programs and private insurance.
Investing in Higher Education and Worker Training
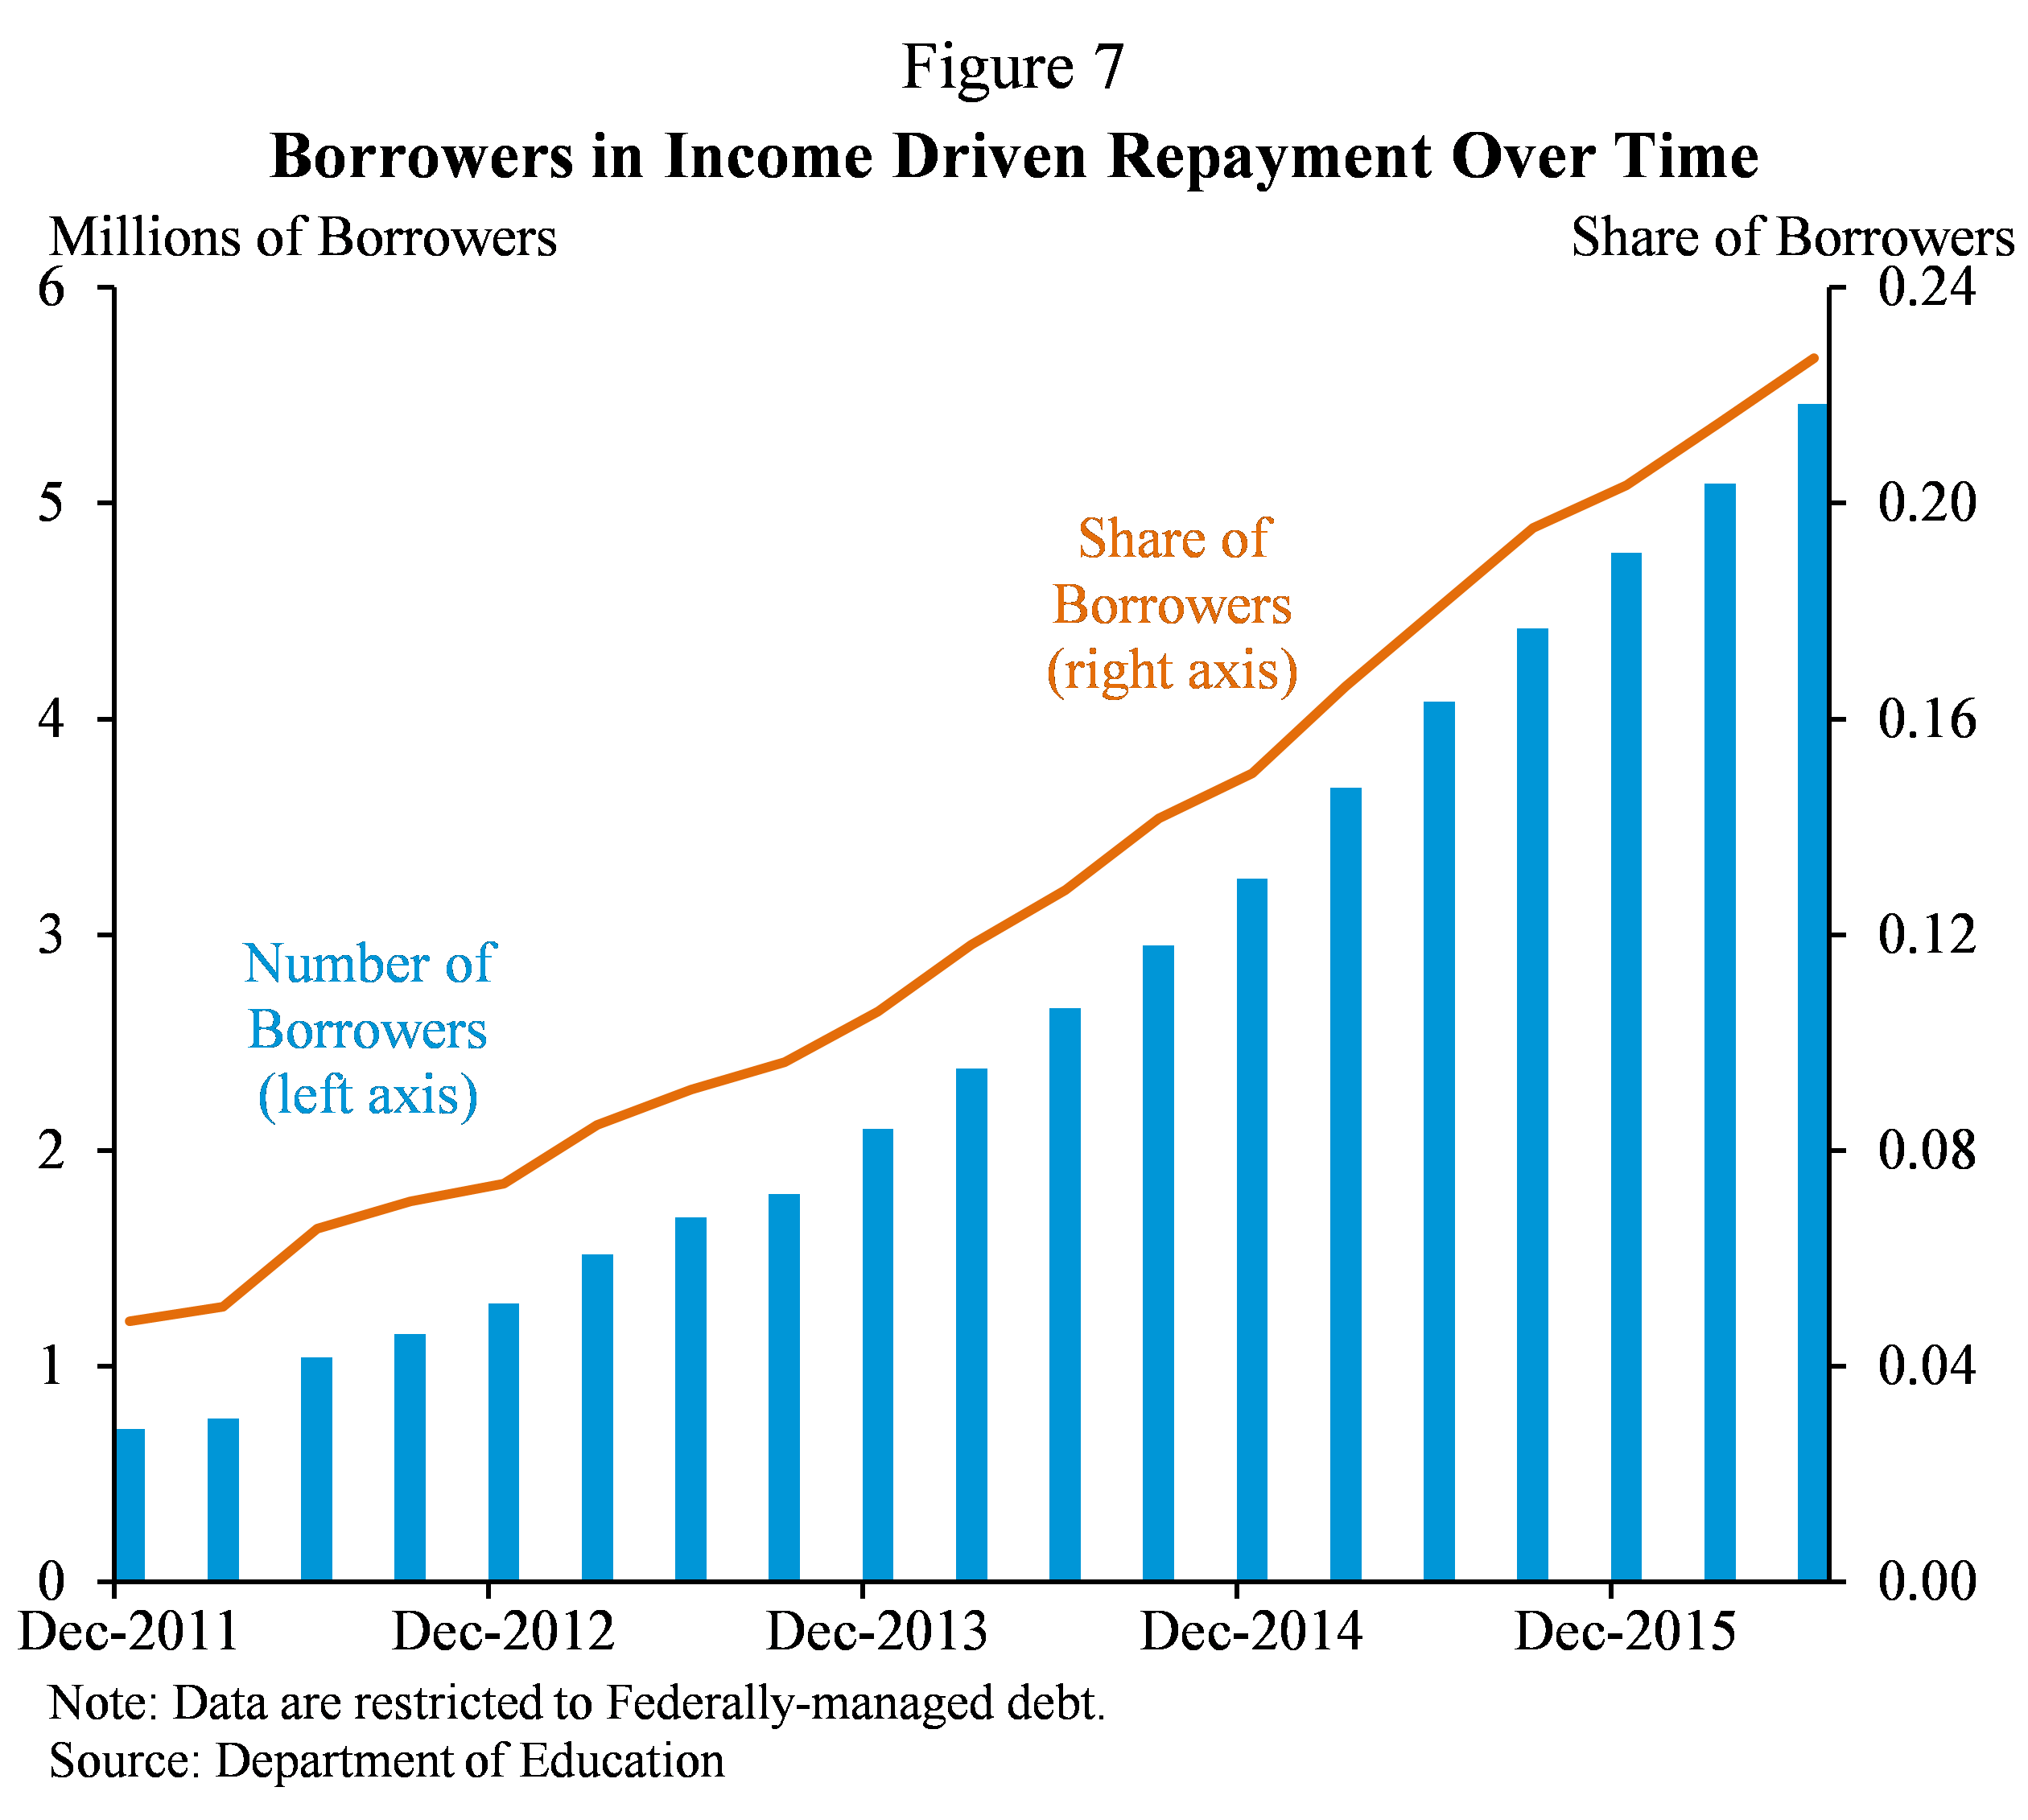
To help expand college opportunity, the President doubled investments in higher education affordability through Pell Grants and the American Opportunity Tax Credit (AOTC). To help more students choose a college that provides a worthwhile investment, the Administration provided more comprehensive and accessible information about college costs and outcomes through the College Scorecard, simplified the Free Application for Federal Student Aid (FAFSA), and protected students from low-quality schools through a package of important consumer protection regulations including the landmark Gainful Employment regulations. To help borrowers manage debt after college, income-driven repayment options like the President’s Pay as You Earn (PAYE) plan have allowed borrowers to cap their monthly student loan payments at as little as 10 percent of discretionary income to better align the timing of student loan payments with the timing of earnings benefits from attending college (Figure 7).
CEA analysis finds that the Pell Grant expansions since 2008-09 enabled at least 250,000 students to access or complete a college degree in 2014-15, leading to an additional $20 billion in aggregate earnings. This represents a nearly two-to-one return on the investment. While more work remains, these policies taken together represent a significant step forward in building an educational system that supports and encourages all Americans who wish to invest in an affordable, high-quality college education to do so.
The President has also prioritized effective forms of worker training, such as apprenticeships. Research shows that apprenticeships tend to lead to high-paying jobs and provide a strong return on investment for employers. Recent Department of Labor data indicate that after program completion, the average registered apprentice earns a starting wage above $60,000, and 89 percent of registered apprenticeship program completers enter employment after exiting. To these ends, the Administration has allocated $265 million toward grants aimed at expanding apprenticeships in the United States. Since 2014, active apprenticeships have increased 31 percent, with an estimated 20,000 new apprentices in the manufacturing industry. The next Administration should take steps to build on this progress in ensuring that Americans are equipped with the skills they need in a more competitive, global economy.
Ensuring All Americans Can Benefit from Technology
The Administration has worked to ensure that the technological infrastructure is in place, and the rules of the road are set, so that all Americans can benefit from technology. The Recovery Act provided funding to deploy or upgrade more than 114,000 miles of new broadband infrastructure, consistent with the President’s goal of enhancing consumer welfare, civic participation, education, entrepreneurial activity, and economic growth through greater access to broadband. The Recovery Act financed additional broadband projects totaling $2.9 billion, bringing high-speed Internet access to 260,000 more rural households, 17,500 businesses, and 1,900 community facilities.
The Administration has taken unprecedented action to free up spectrum—the airwaves that carry our wireless communications. Thanks in large part to these efforts, we have achieved the President’s 2011 State of the Union goal that more than 98 percent of Americans should have access to fast 4G/LTE mobile broadband. Further, the President supported FCC rules to protect net neutrality—the concept that Internet providers must treat all Internet traffic equally. By putting into effect strong net neutrality rules, the FCC has helped ensure that the Internet remains open, fair, and free.
Finally, the Administration has helped workers get the skills and training they need for jobs in the 21st century. The TechHire initiative—which works to expand local tech sectors by providing training assistance through grants and public-private partnerships and has now been rolled out to 50 communities with 600 employers participating—is actively drawing on people from all backgrounds, including young adults who are disconnected from school and work, the long-term unemployed, and those living in rural areas where access to technology training is scarce. In support of TechHire, the Department of Labor awarded 39 grants—totaling $150 million—for programs in 25 States and the District of Columbia to support innovative ways to get more than 18,000 participants on the fastest paths to well-paying jobs in in-demand sectors such as information technology (IT), healthcare, advanced manufacturing and financial services.
Strengthening the Financial System
The 2007-08 financial crisis revealed a number of fault lines in the U.S. financial system. Many banks were inadequately capitalized, did not have enough liquidity, and took too many risks. Many non-bank financial firms faced the same risks as banks, but lacked the same regulatory supervision or protection against runs. In addition, gaps in the regulatory architecture meant that financial regulators lacked a holistic view of the risks in the system.
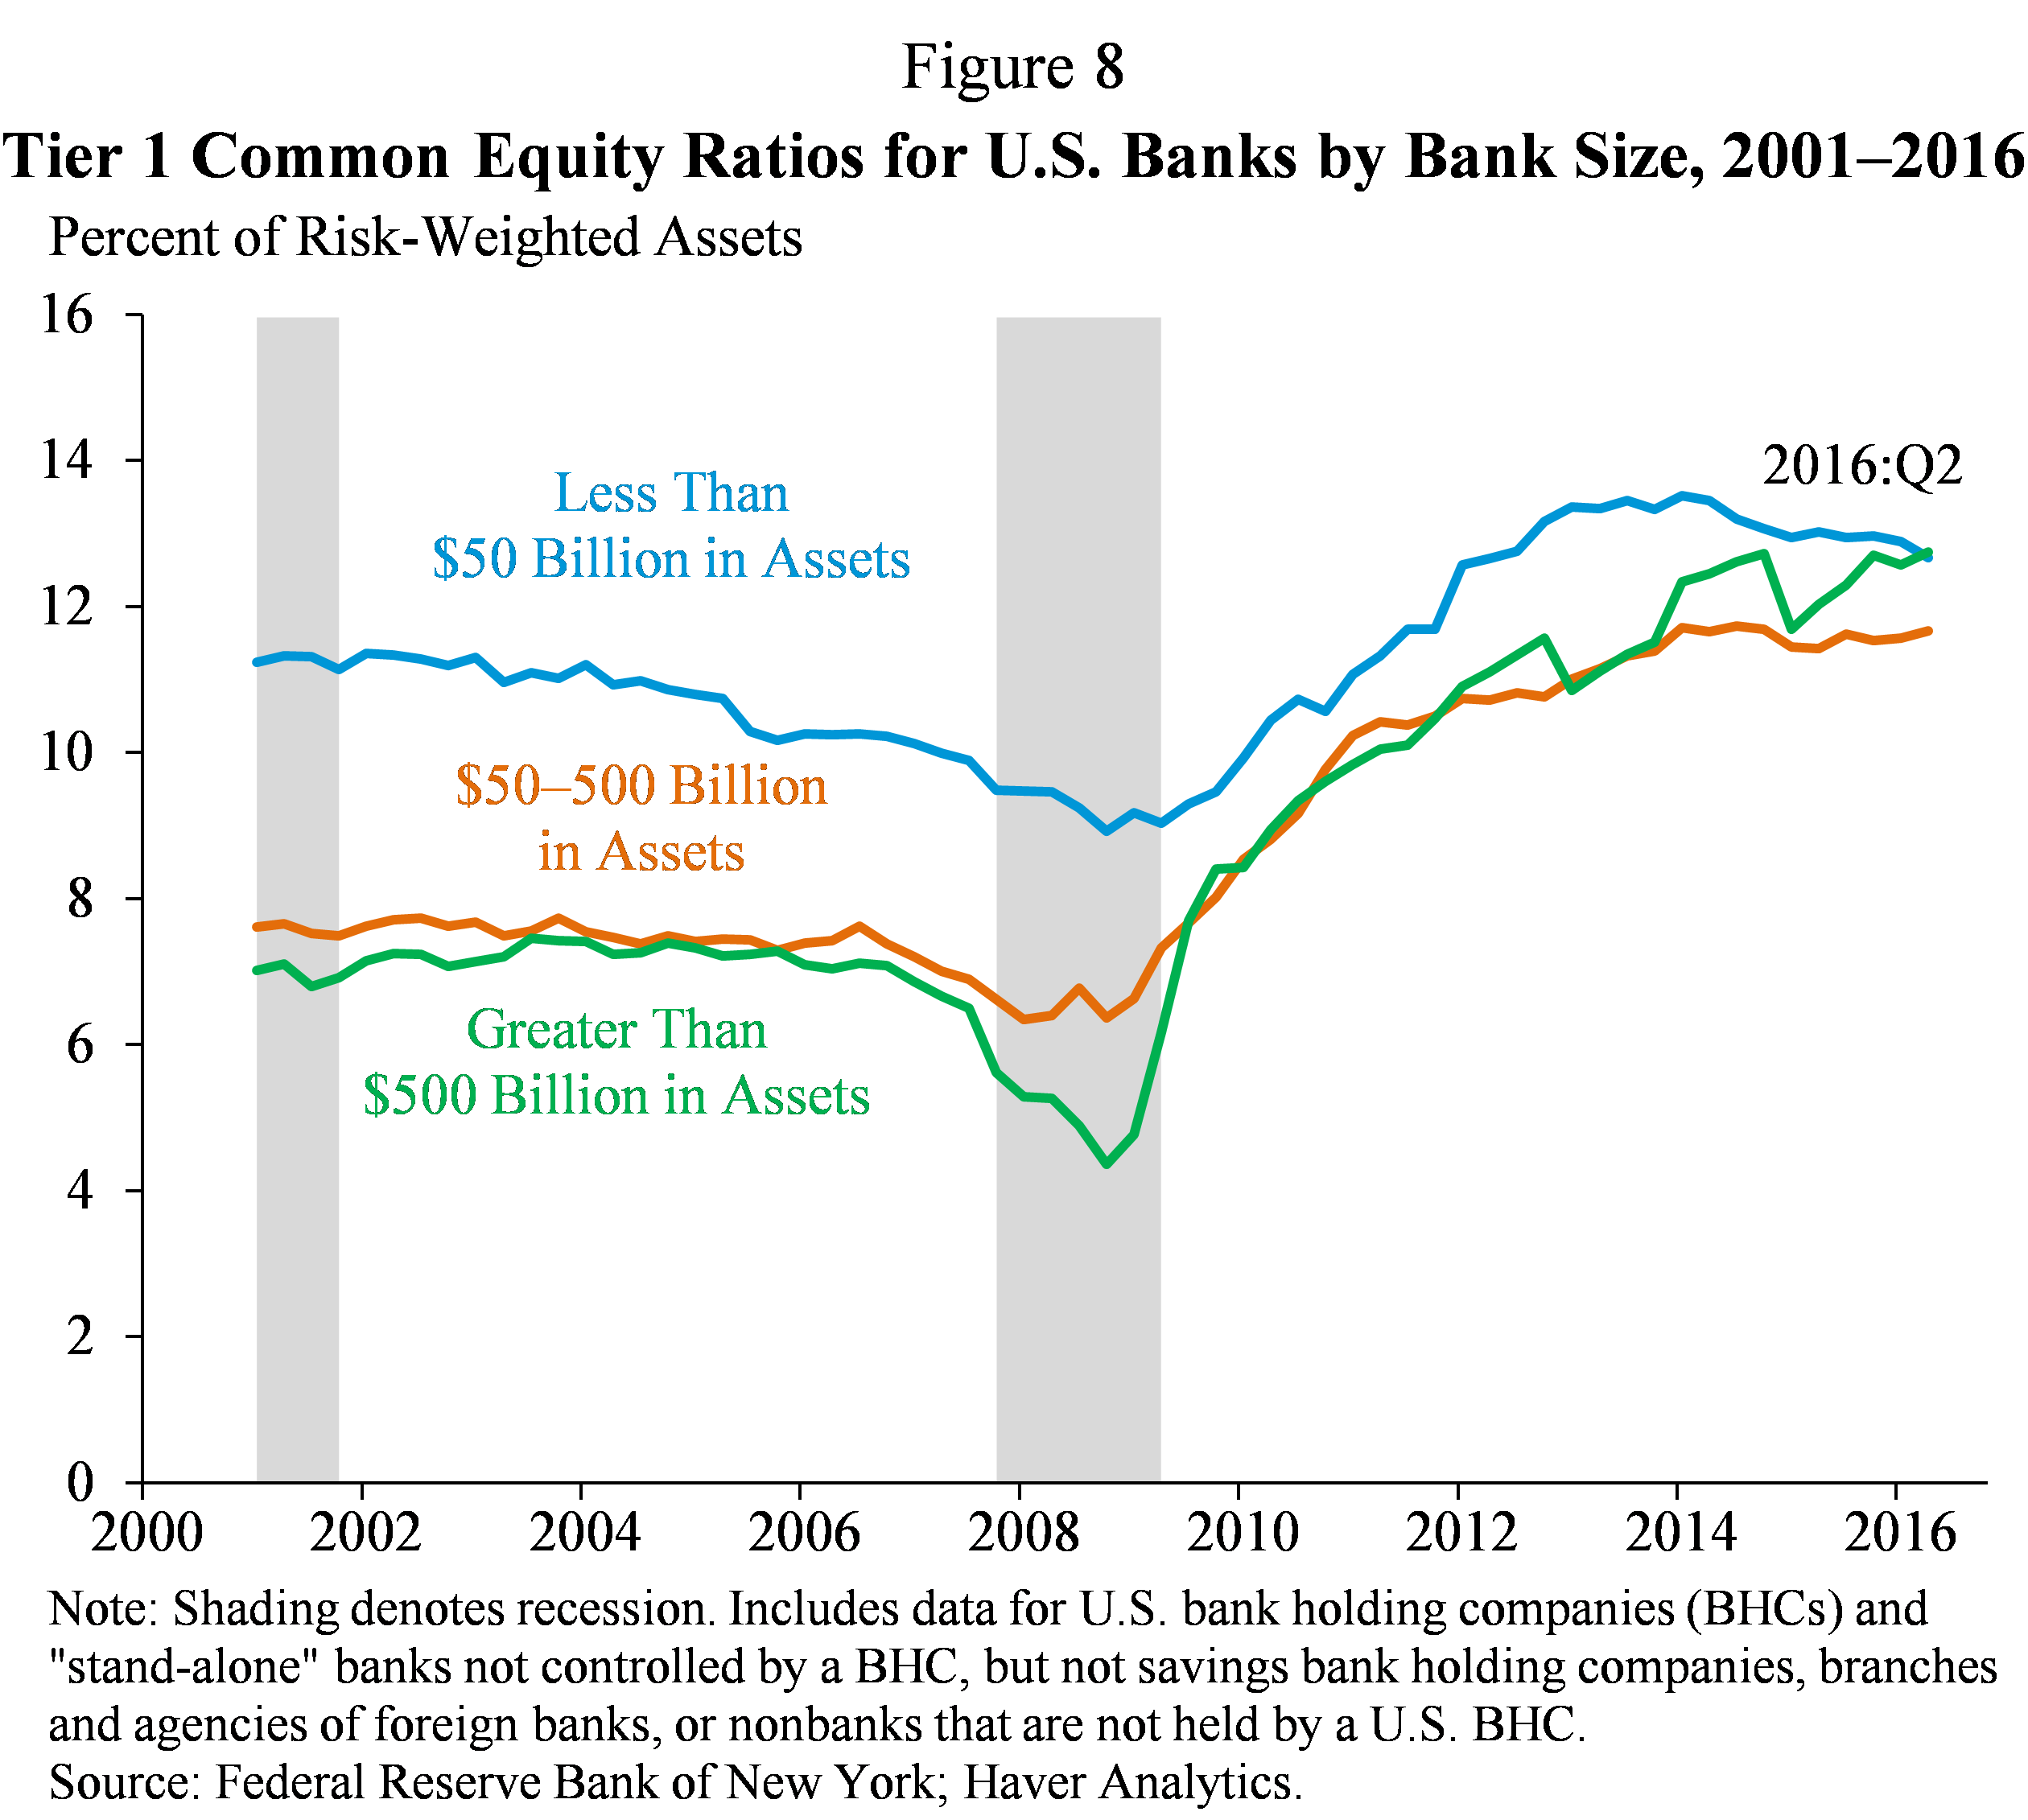
Financial reforms under the Obama Administration have helped make the financial system more secure by requiring financial firms to have less unstable funding, more liquid assets, higher capital levels (Figure 8), and reduced risk-taking. The recovering economy and implementation of financial reform have been accompanied by strong performance of a wide variety of financial market indicators. Not only have financial markets recovered from the losses suffered during the crisis, but banks are healthier and stronger, regulators are on the lookout for systemic risk, once-opaque derivatives markets are safer and more transparent, credit ratings agencies are subject to more effective oversight and increased transparency, and investor protections have been strengthened. Banks and other financial institutions now face different rules designed to make them safer and less of a threat to the overall system. Consumers also have a new agency, the Consumer Financial Protection Bureau (CFPB), looking out for their interests in the financial system. These longer-run reforms have reshaped and ensured greater resilience in the financial regulatory system of the United States.
Promoting American Prosperity in the International Economy
The Administration has moved on several international fronts to promote America’s prosperity and security. Close cooperation and coordination with our international partners was a key factor in staving off a second Great Depression. The President took steps to make the G-20 the premier forum for international economic cooperation, and efforts by the G-20 have made the global economy better able to weather financial shocks and to prevent them from causing broader economic damage on Main Street and across borders. We have consistently used these fora to encourage our partners to focus on supporting global growth to lift living standards both abroad and at home. In addition, the United States has initiated and strengthened high-standards trade agreements with countries across the world, seeking to open foreign markets to U.S. goods and services and ensure a level playing field for workers and businesses, among them the Trans-Pacific Partnership (TPP) agreement. TPP would eliminate over 18,000 tariffs, establish the highest labor and environmental standards of any trade agreement in history, enhance opportunities for small and medium enterprises, promote Internet-based commerce, protect American workers and businesses from unfair competition from foreign state-owned enterprises, and strengthen transparency and anticorruption. Leadership on trade policy helps America write the rules of the road for global commerce, rather than leaving it to countries that may not share our values or interests. The Administration has also taken aggressive action to hold our trading partners to the agreements they sign, enforcing our trade rules to make sure that American goods and services can be sold around the world and that products coming to the United States are traded fairly
Addressing Climate Change
Finally, the Administration has also demonstrated a commitment to fighting climate change through a diverse set of policy approaches. In 2009, the Administration made a historic investment of more than $90 billion in clean energy in the Recovery Act, helping to spur both a dramatic increase in clean energy capacity and advances in clean energy technology. The President’s 2013 Climate Action Plan mapped out a new framework for the transformation to a more energy-efficient economy with lower greenhouse gas emissions. Related policies and initiatives included the first-ever Federal greenhouse gas pollution standards for power plants, light-duty cars and trucks, and commercial trucks, buses, and vans; investments in research and development to support innovative clean energy technologies; enhanced incentives for renewable energy and improvements in the energy efficiency of homes and appliances; and stronger international cooperation to drive down greenhouse gas emissions and limit increases in global temperatures. The Administration has worked to ensure that environmental regulations are undertaken in an efficient and cost-effective manner, as documented by rigorous regulatory impact analysis. There are already signs of progress: while the U.S. economy has continued to grow, it is becoming less energy- and carbon-intensive as both our fossil fuel mix becomes cleaner (due to rising natural gas use) and renewable energy takes an increasingly large role in U.S. energy generation. U.S. carbon dioxide emissions from the energy sector fell by 9.5 percent from 2008 to 2015, and in the first half of 2016 were at their lowest level in 25 years.
The Challenges Ahead: Productivity, Inequality, Participation, and Sustainability
The Obama Administration has taken great strides in addressing many structural barriers to inclusive growth over the last eight years, working to ensure both that growth is stronger in the future and that the benefits of this growth are more widely shared among American households. However, these efforts have only started to address the structural obstacles to future prosperity for middle-class families. Many of these barriers have been decades in the making, and many are shared across a wide range of advanced economies. Addressing four of these structural challenges—boosting productivity growth, combatting rising inequality, raising labor force participation, and building a resilient economy that does not grow today at the expense of the future—will be critical in the years ahead years ahead, and I encourage the next Administration and next Congress to take action to address them.
Productivity Growth
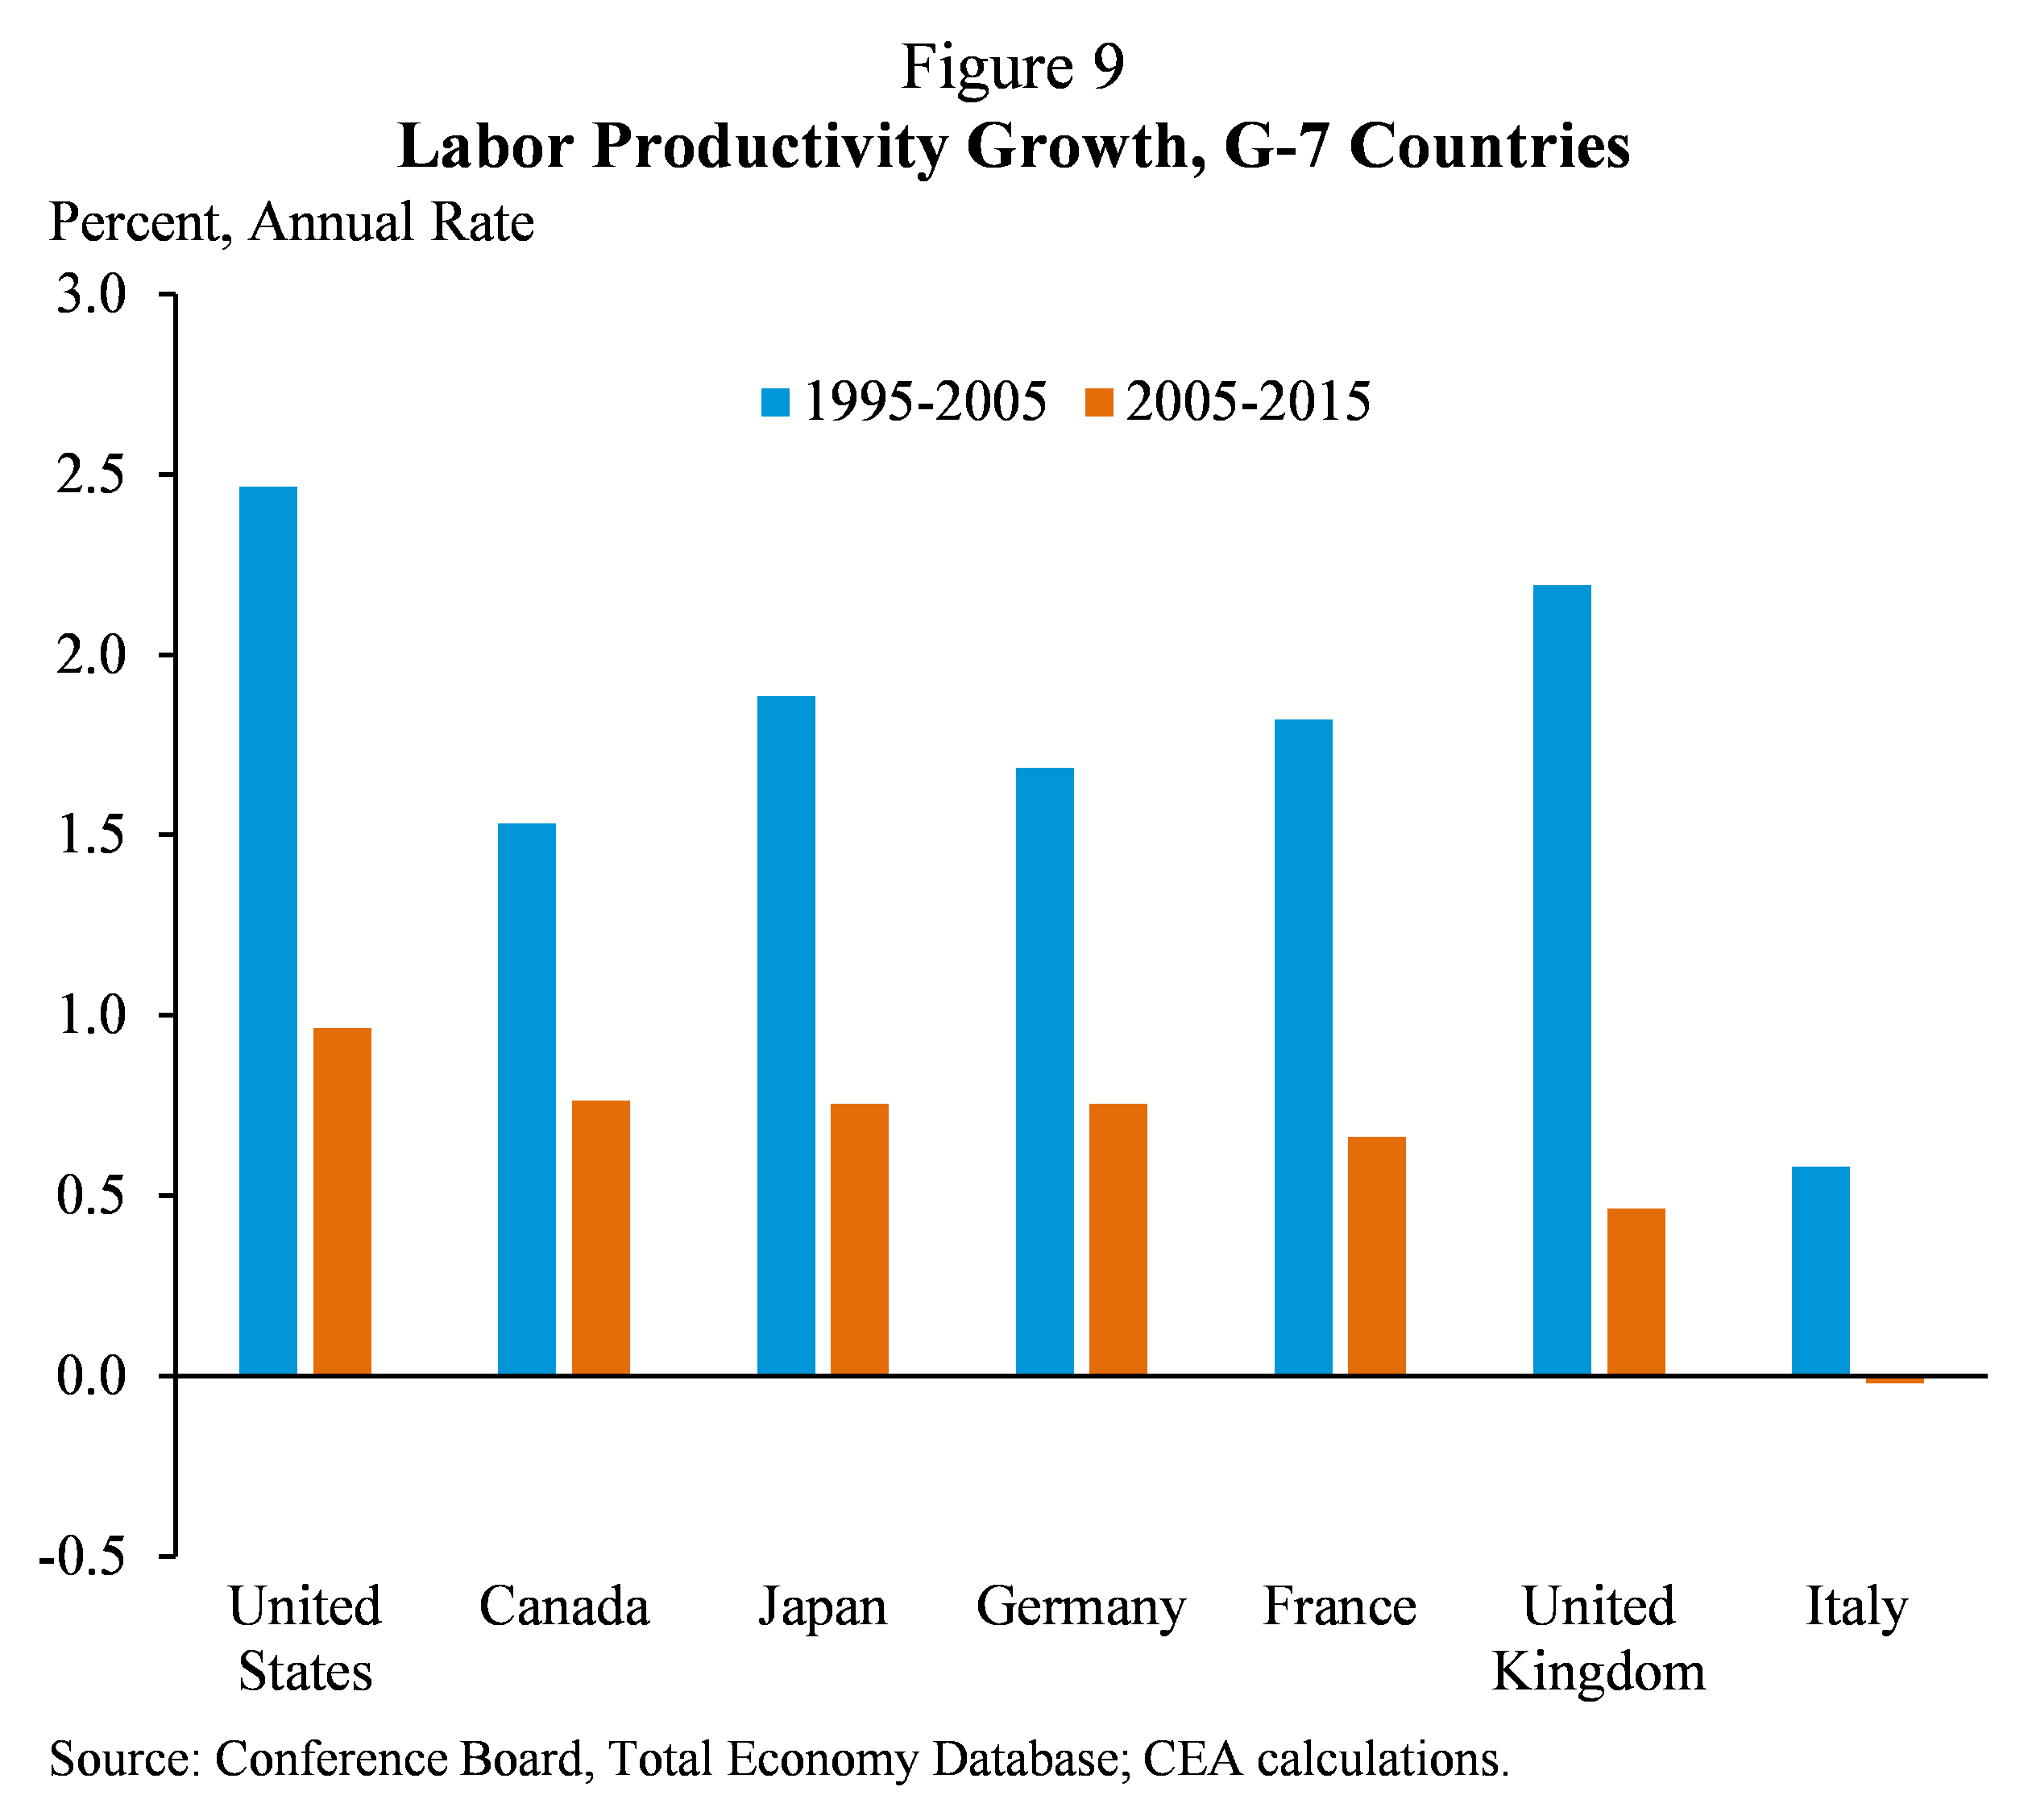
The single most important determinant of living standards, across countries and over time, is labor productivity—the amount of output a worker can produce in an hour of work. However, productivity growth has slowed across a wide range of advanced economies in recent years. Average annual productivity growth in advanced economies slowed to less than 1 percent from 2005 to 2015, roughly half the rate of the previous decade—with productivity slowing in 30 of 31 advanced economies, including all of the G-7 economies, as shown in Figure 9. Despite its sharp slowdown, the United States has had the strongest record in terms of productivity growth in the last decade among the G-7 economies.
Productivity growth is critical to the long-run health of the U.S. economy because it is a necessary component of both potential GDP growth and real increases in household incomes, and thus living standards. A range of policies can help boost labor productivity growth. These include increasing public investment in infrastructure; providing greater funding for research and development; reforming the business tax code to better incentivize innovation and investment; promoting high-skilled immigration; continuing to improve education and worker training; and expanding trade, which can boost innovation through the spread of ideas across borders, greater specialization in innovative activities, access to larger markets by high-productivity firms, and expanded competition.
Income Inequality
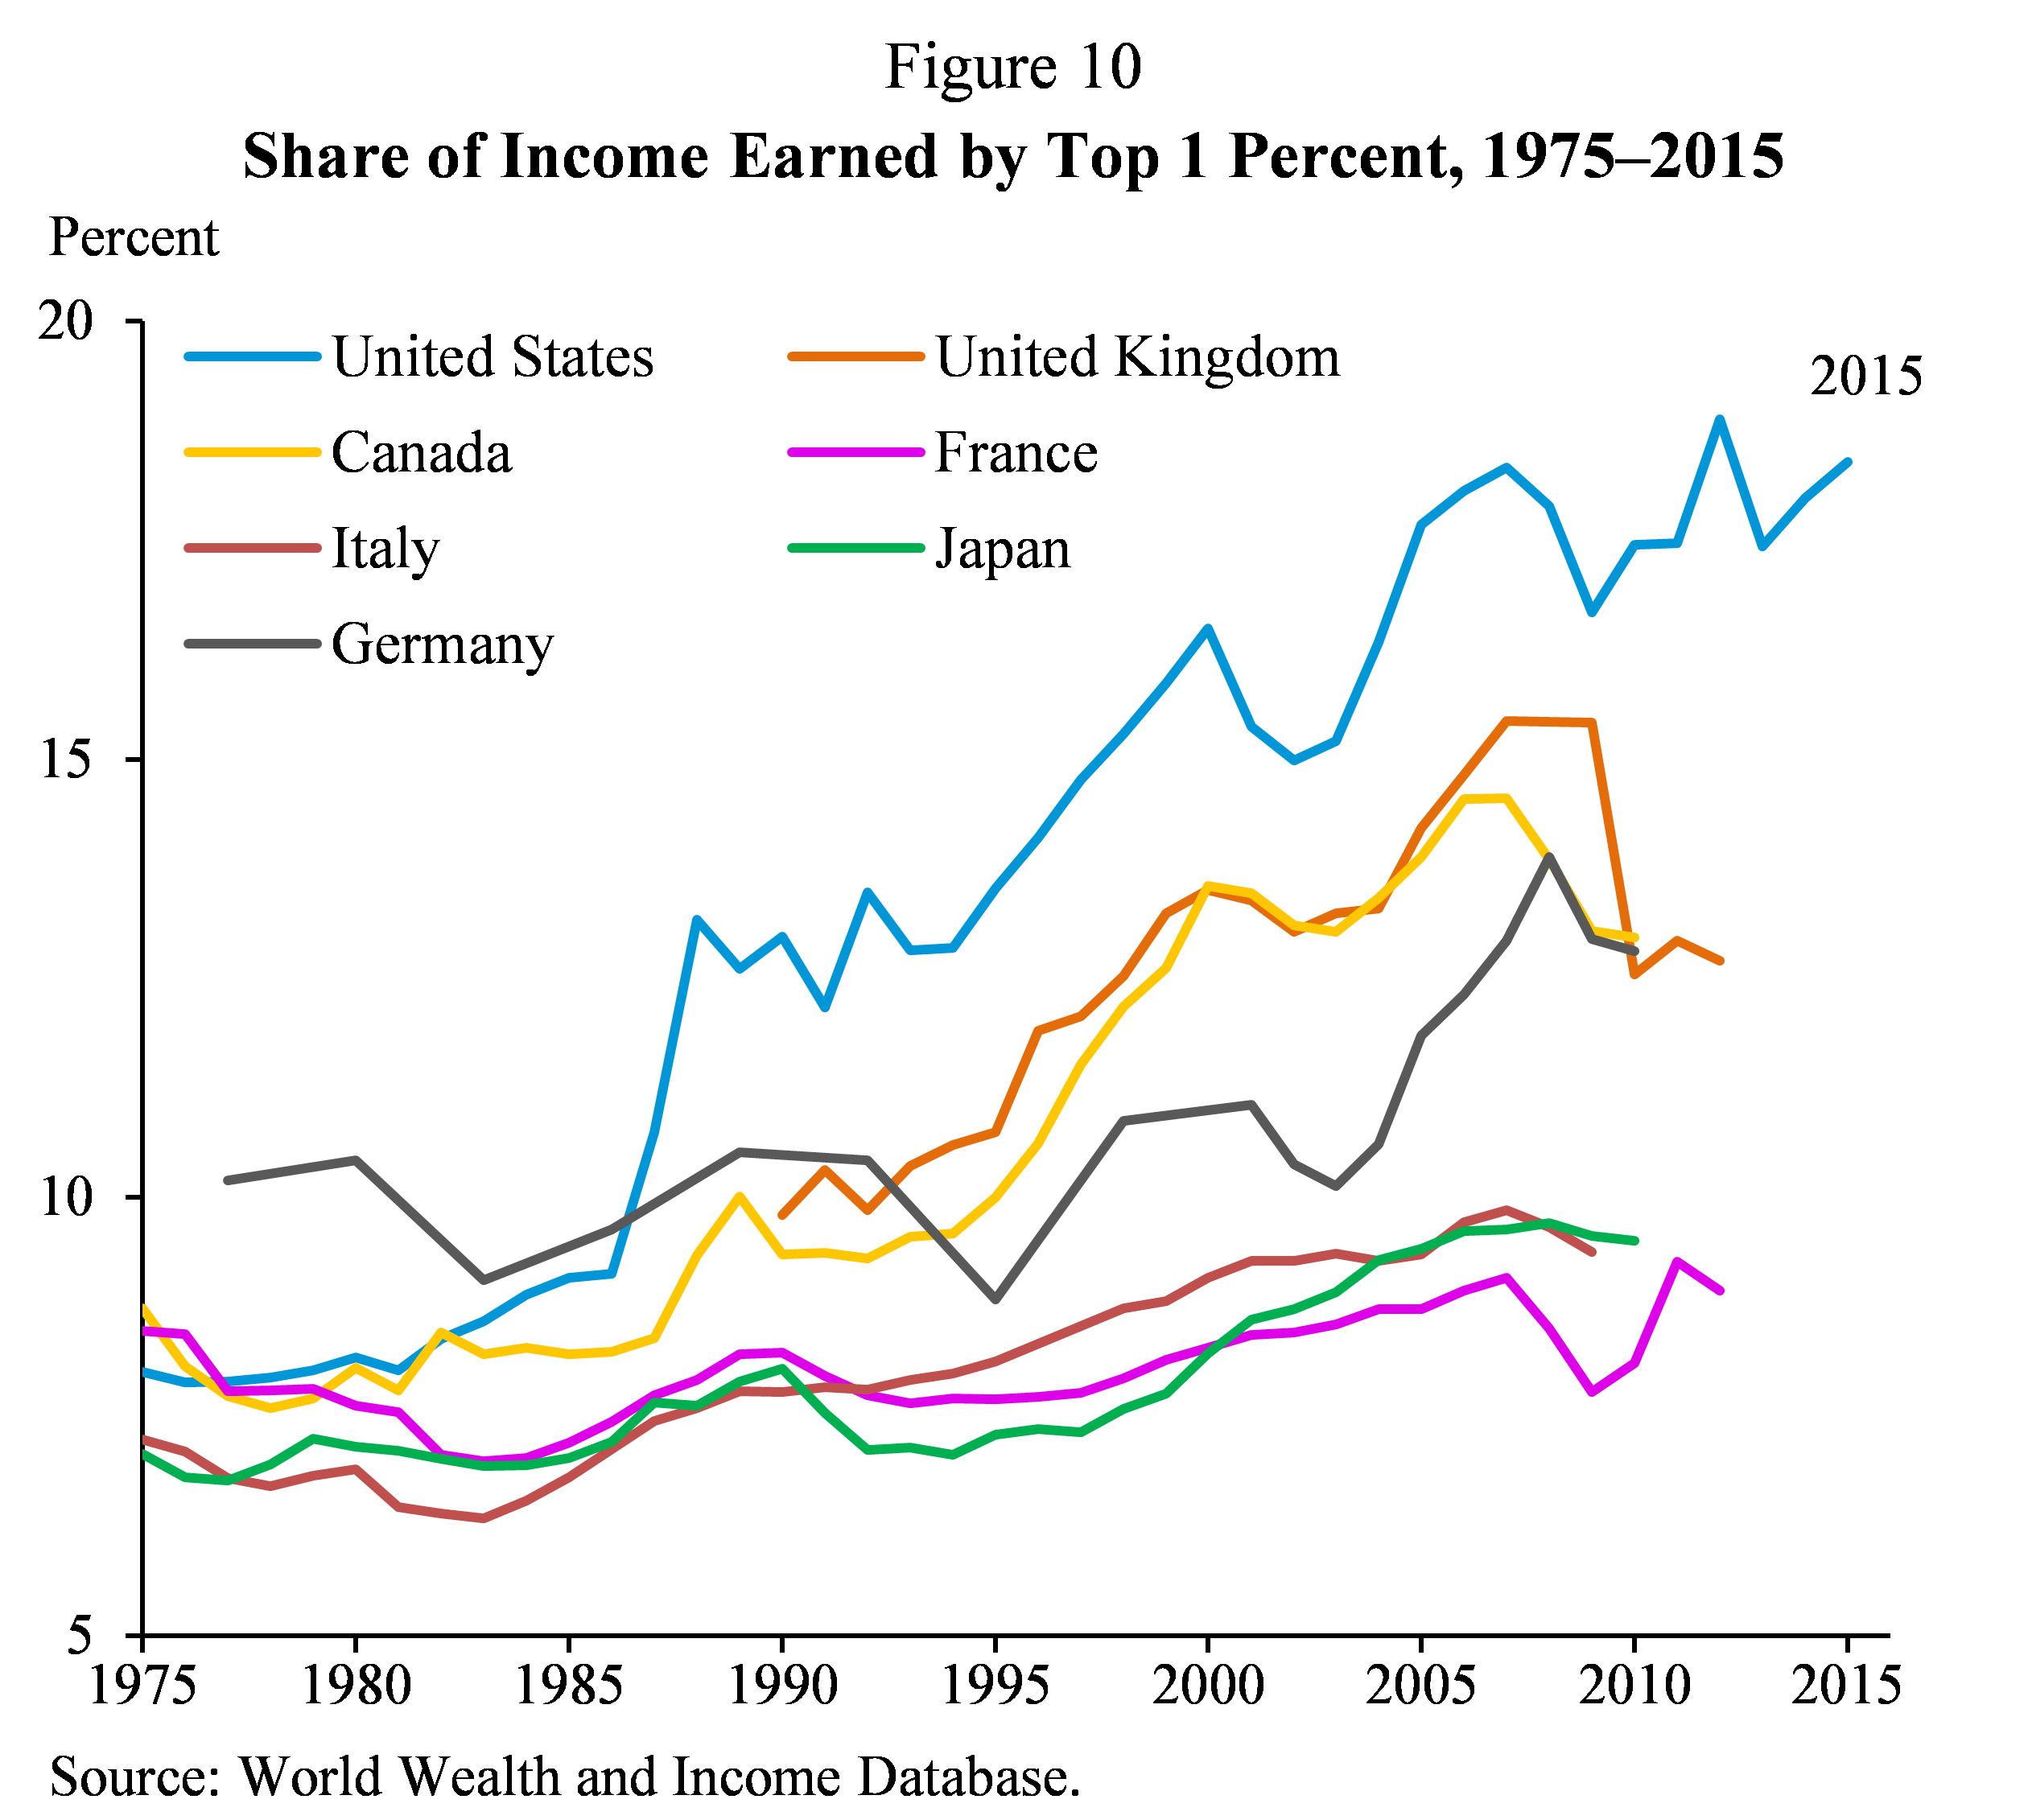
In the long run, productivity growth is the most important factor in increasing earnings. But income growth for households across much of the distribution also depends on the degree to which economic gains are shared, or, in other words, on the degree of income inequality. Here, too, the trend among advanced economies has been unfortunately similar, with the majority seeing increased inequality in recent decades. However, the United States has the highest levels of inequality, and has seen a faster increase in inequality, than any of the G-7 economies, as shown in Figure 10.
Despite the historic progress in rolling back rising inequality over the last eight years described above, more work remains to combat high levels of inequality in the United States in both pre-tax-and-transfer and after-tax-and-transfer incomes. Policies like expanded access to quality education, increasing the minimum wage, providing greater support for collective bargaining and other forms of worker voice, and reforming barriers to mobility like occupational licensing requirements and land-use restrictions to reduce rents can all play a role in reducing inequality. Meanwhile, making the fiscal system more progressive by, for example, expanding tax credits for low-income workers financed by higher tax rates on high-income households would reduce inequality in after-tax incomes. A growing body of evidence has also found that a more progressive fiscal system does not just increase after-tax incomes for low- and moderate-income households; when fiscal transfers (such as programs for health, nutrition, cash assistance, and housing support) are focused on children, they can also increase future earnings and educational outcomes.
Labor Force Participation
Household incomes also depend on the labor force participation rate: the share of the adult population working or actively in search of work. In recent years, the participation rate has faced substantial downward pressure from the aging of the U.S. population as members of the baby-boom generation begin to retire. This demographic trend implies a decrease in the overall participation rate of about a quarter of a percentage point a year. However, the participation rate has been broadly stable since the end of 2013, as the strong recovery of the U.S. labor market has pulled workers into the labor force and offset the downward pressure from the aging of the population.
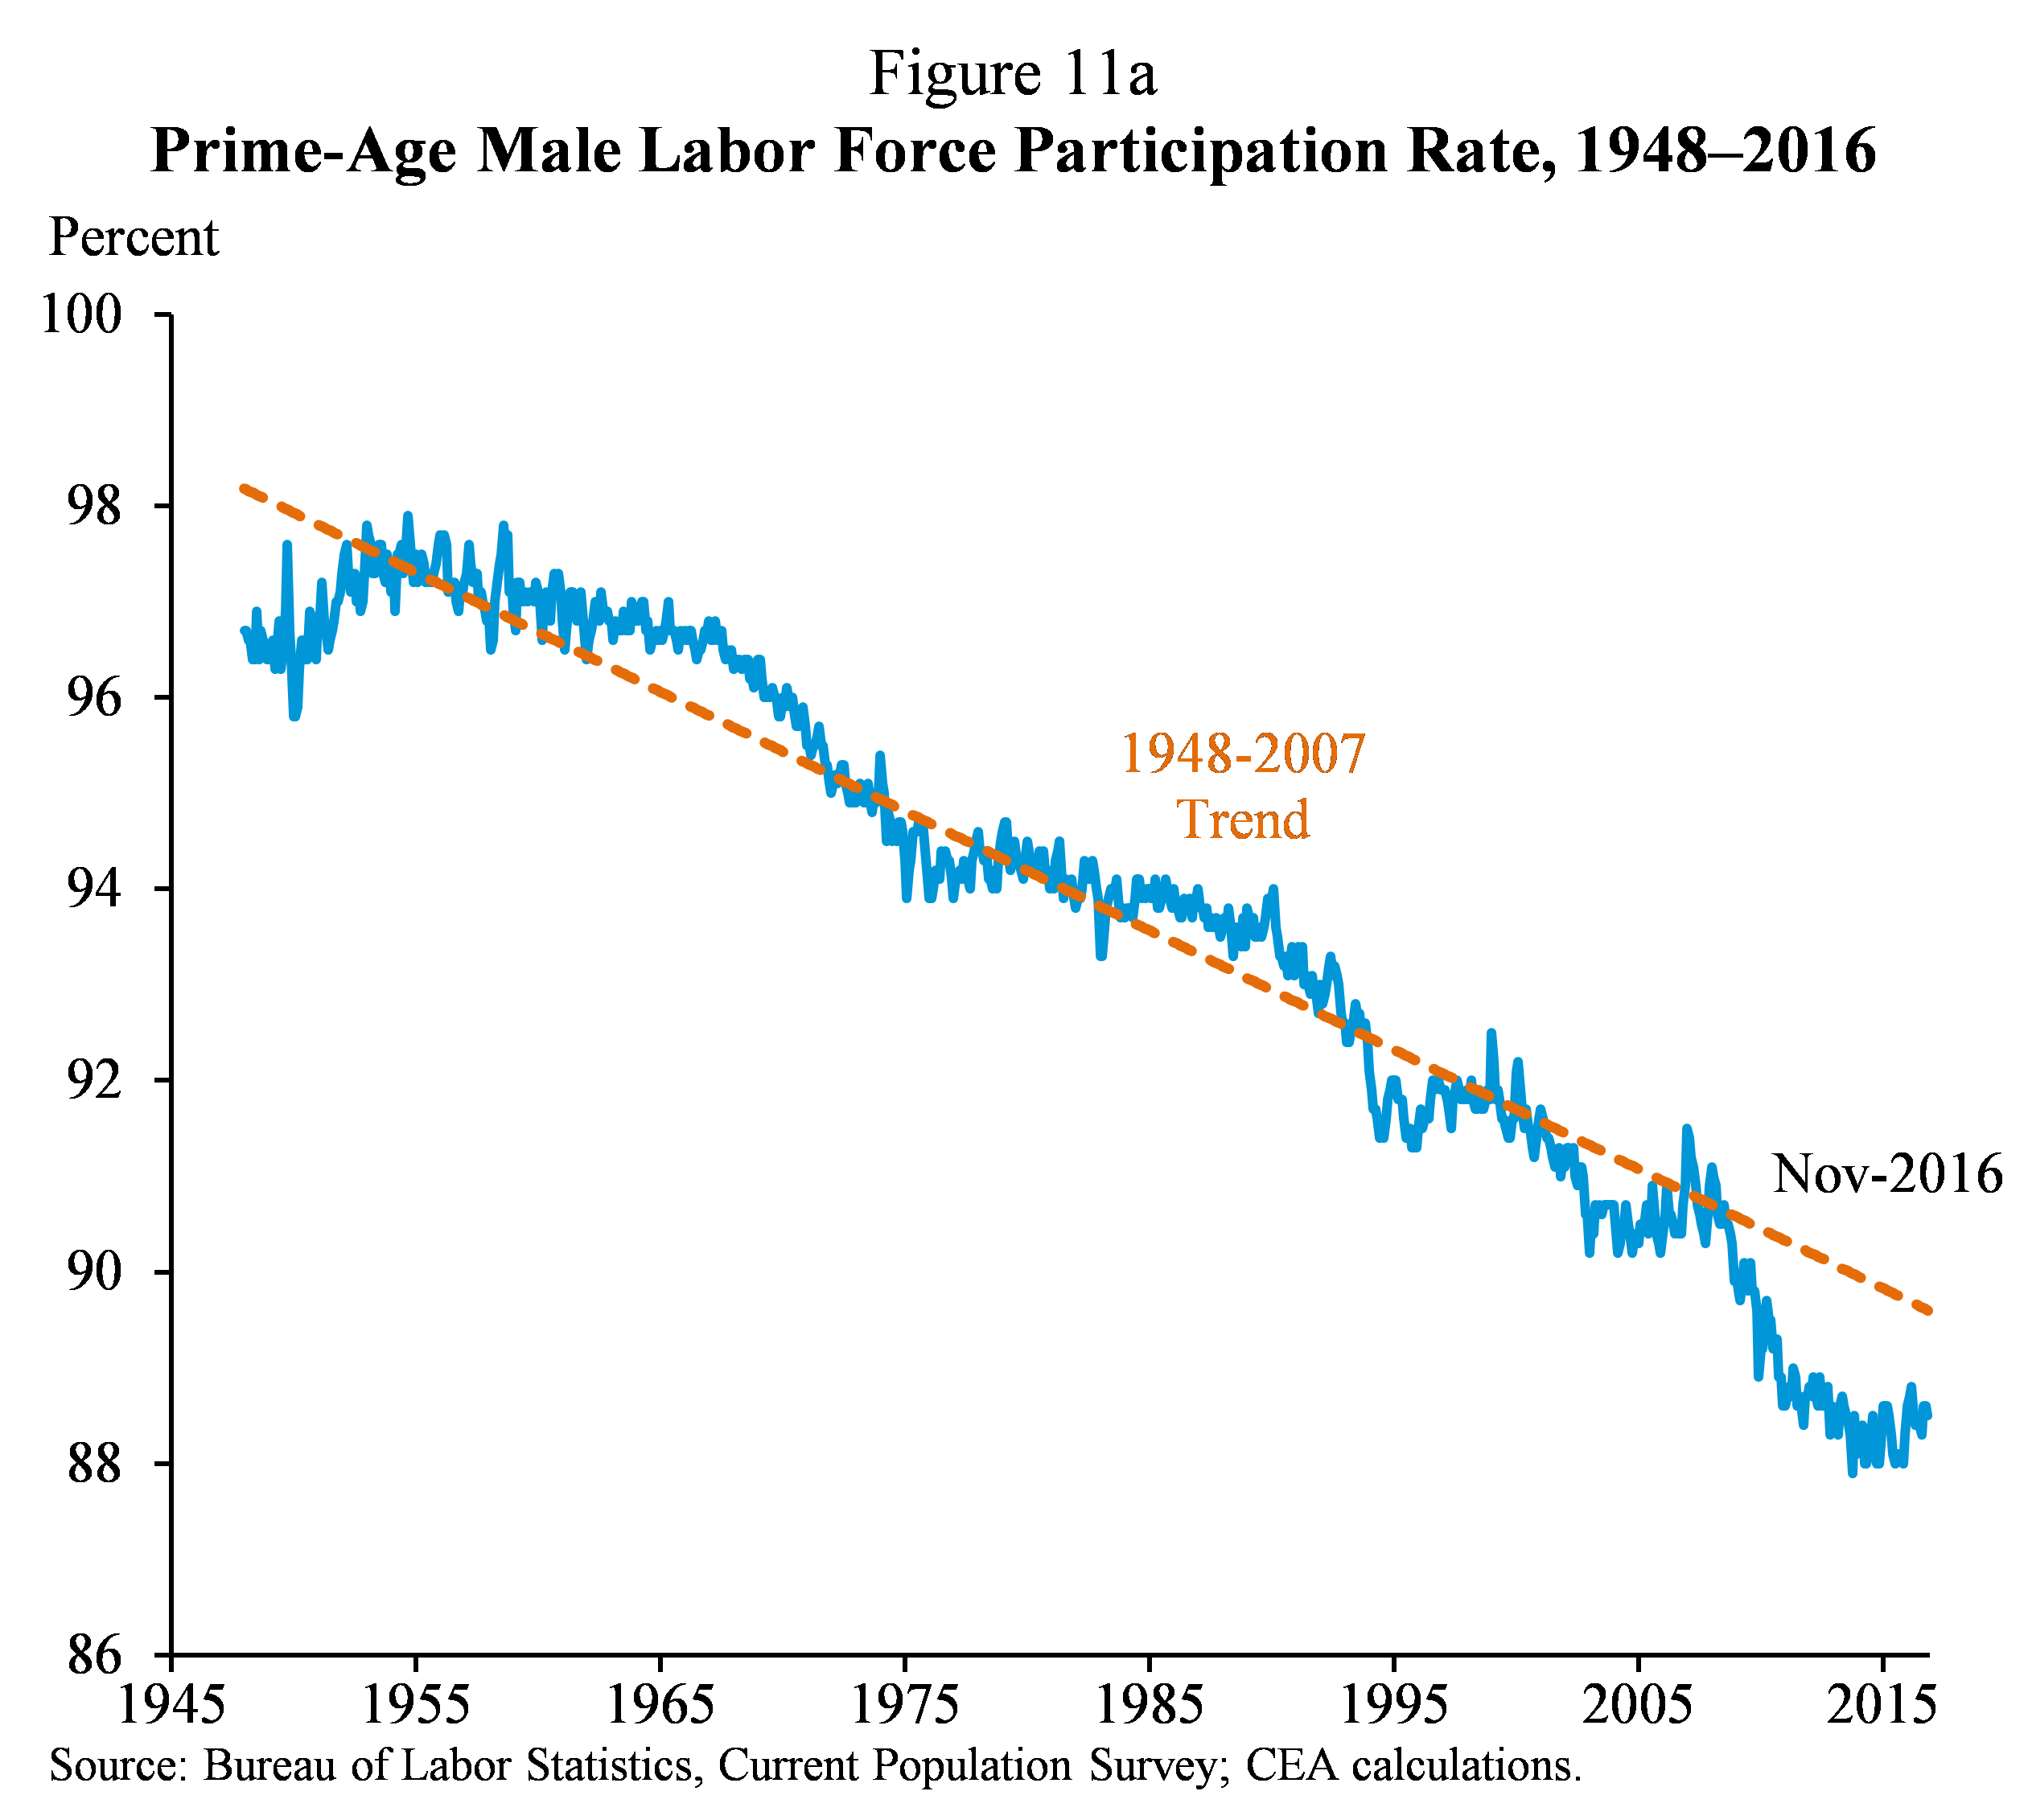
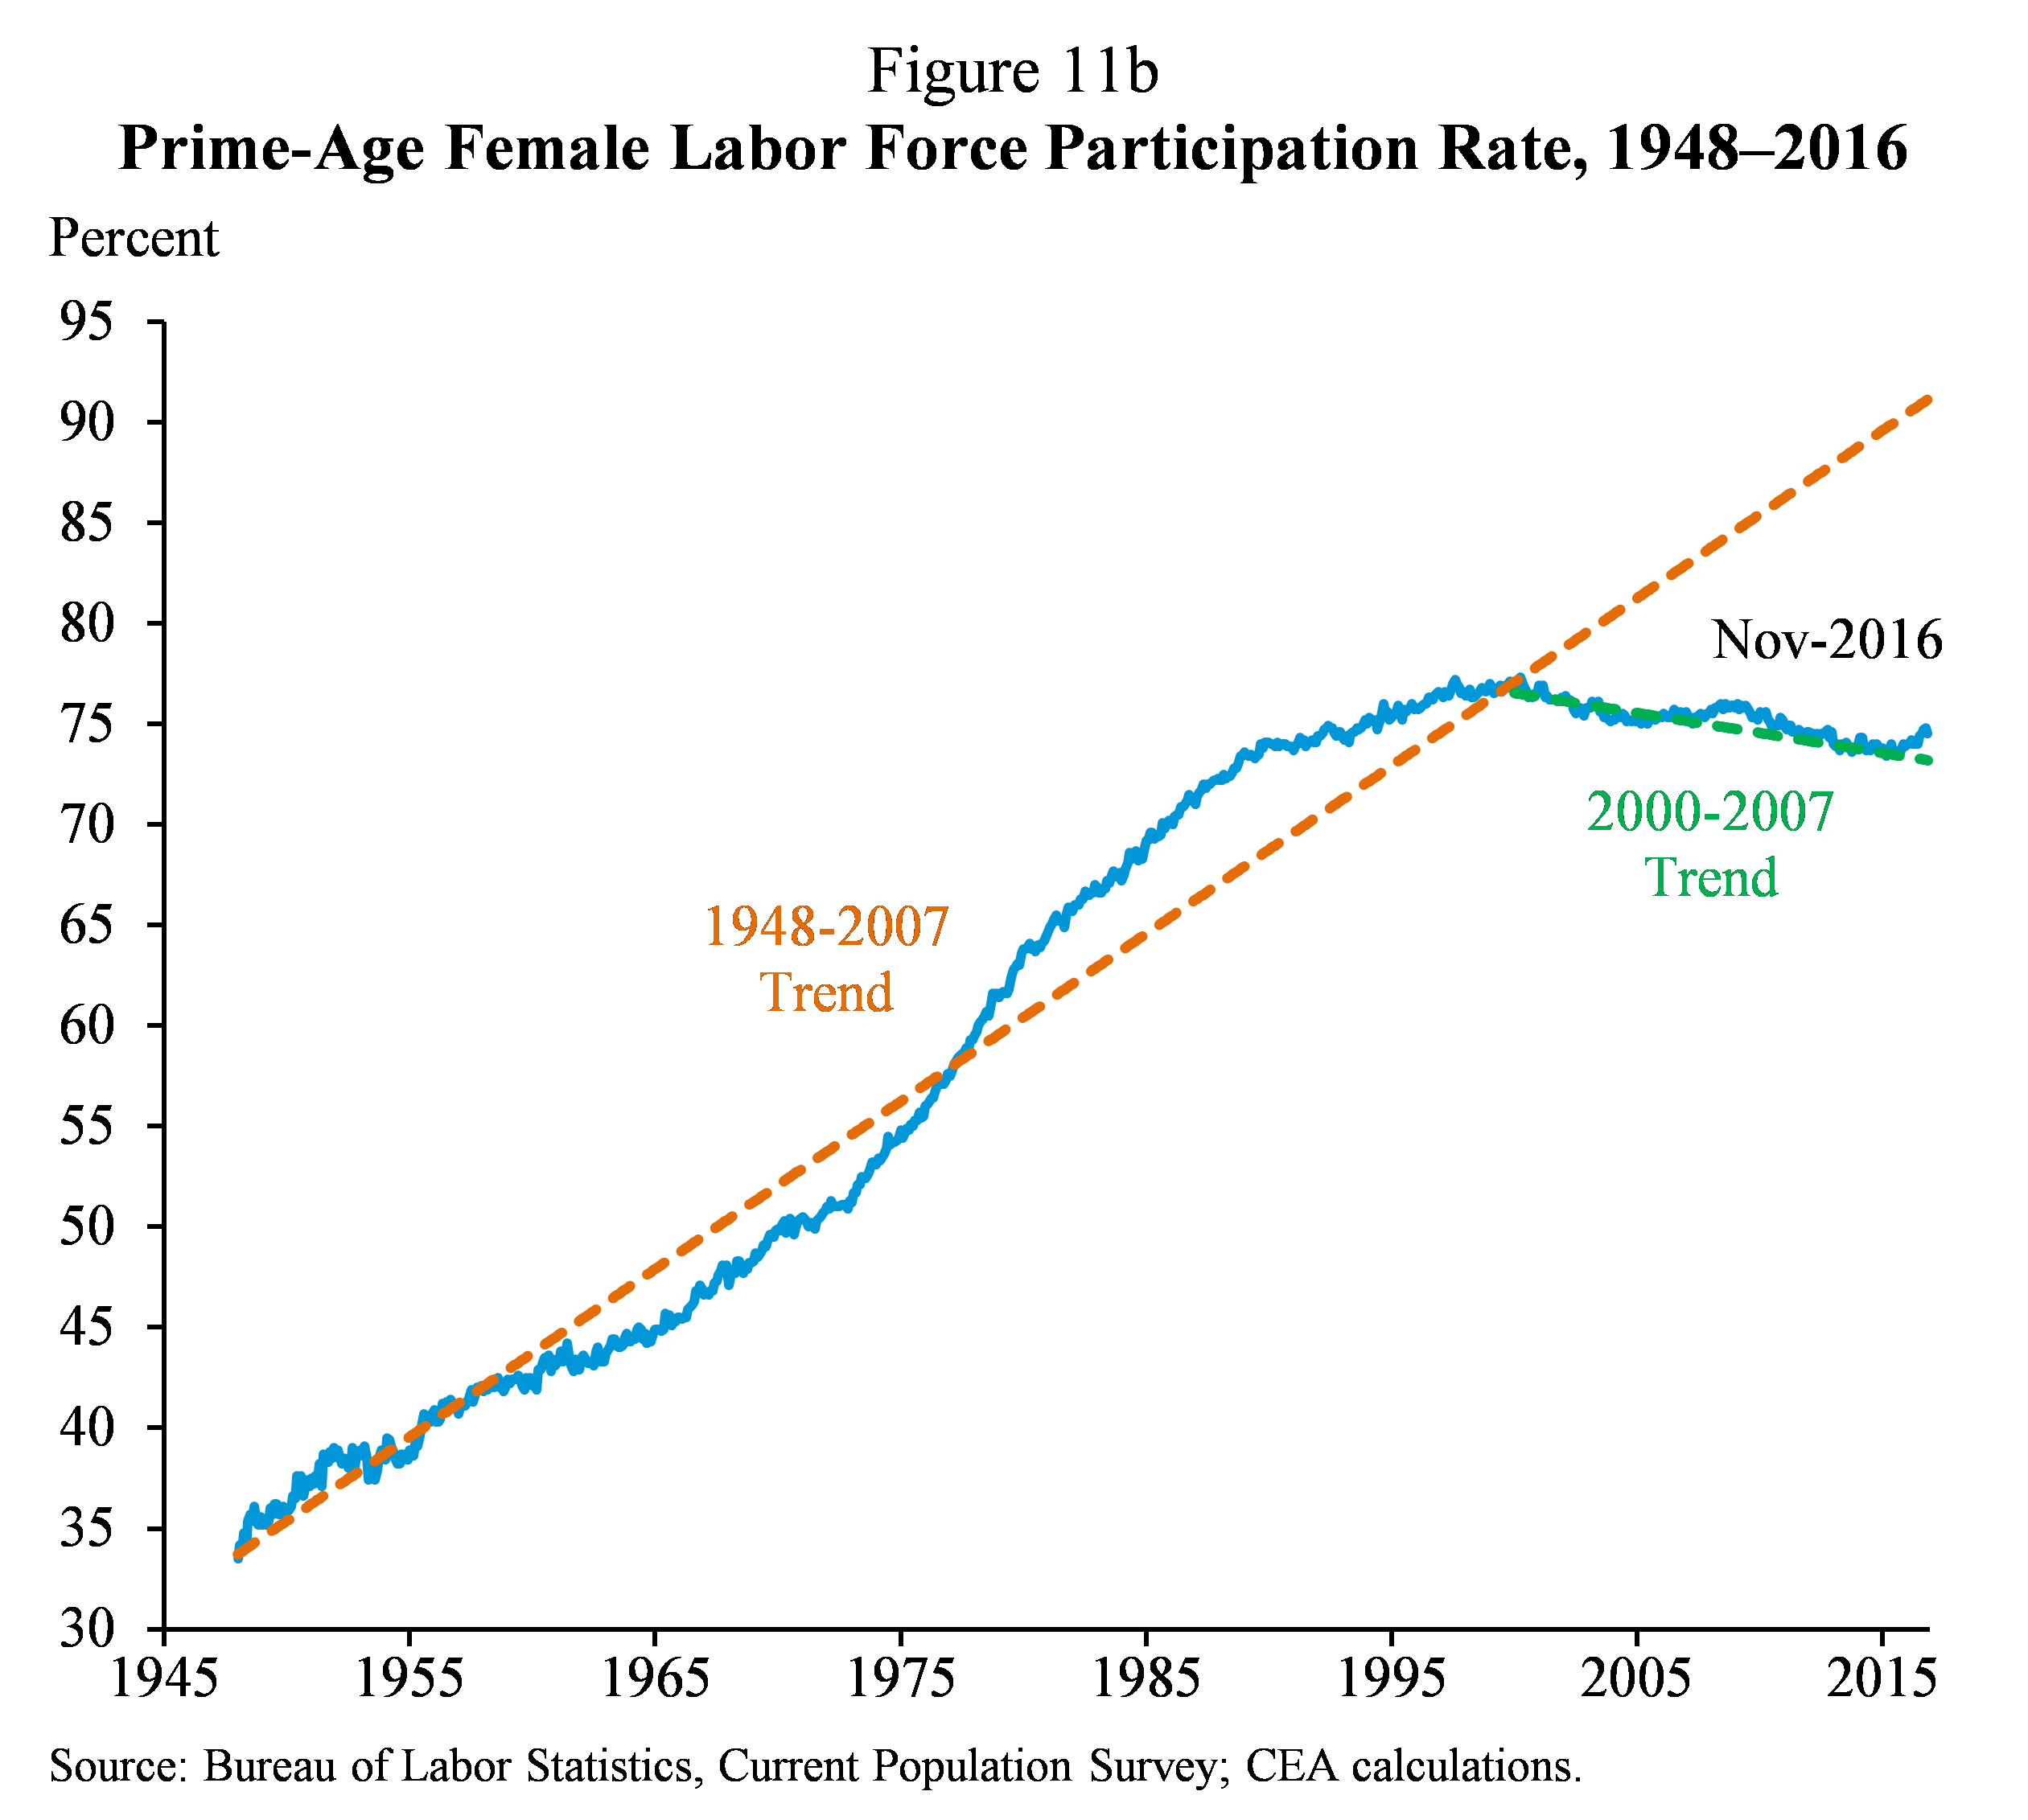
But the United States faces an additional long-run challenge of declining participation among “prime-age” workers, those between the ages of 25 and 54. This troubling pattern in labor force participation goes back for more than a half-century for men and about a decade and a half for women. In 1953, 3 percent of prime-age men did not participate in the labor force. In November 2016, the fraction stood at 12 percent (Figure 11a). Nonparticipation has been even higher in recent years for men with less educational attainment: in 2015, 17 percent of prime-age men with a high school degree or less did not participate in the workforce. Meanwhile, 25 percent of prime-age women do not participate in the labor force today, compared to 23 percent in 1999 (Figure 11b). Over the second half of the 20th century, the decline in prime-age male labor force participation was largely obscured in aggregate data by rising female participation and favorable demographics. But as the trend for prime-age women plateaued and then reversed, the impact of declining prime-age participation on the overall labor force participation rate has been far clearer in recent years.
Economic Sustainability
Even as work remains to boost productivity growth and labor force participation and to combat rising inequality, the Nation must take a number of steps to ensure that economic growth is sustainable and does not come at the expense of future prosperity.
Given the current strong position of the U.S. economy in the business cycle, steps should be taken to protect against future recessions, helping to ensure that just as we avoided a second Great Depression, we are able to avoid a second Great Recession. In particular, modifying the design of automatic stabilizers like unemployment insurance such that they are automatically expanded or extended during downturns would provide better countercyclical support for the economy during recessions. Moreover, as demonstrated by the Obama Administration’s efforts, it is possible to combine short-run fiscal expansion with medium- and long-run fiscal consolidation to maintain fiscal discipline. Further curbs to the growth of entitlement costs that build on the ACA’s progress in reducing health care costs, as well as limiting tax breaks for those at the top of the income distribution, can also help address our long-term fiscal challenges without sacrificing investments in growth and opportunity.
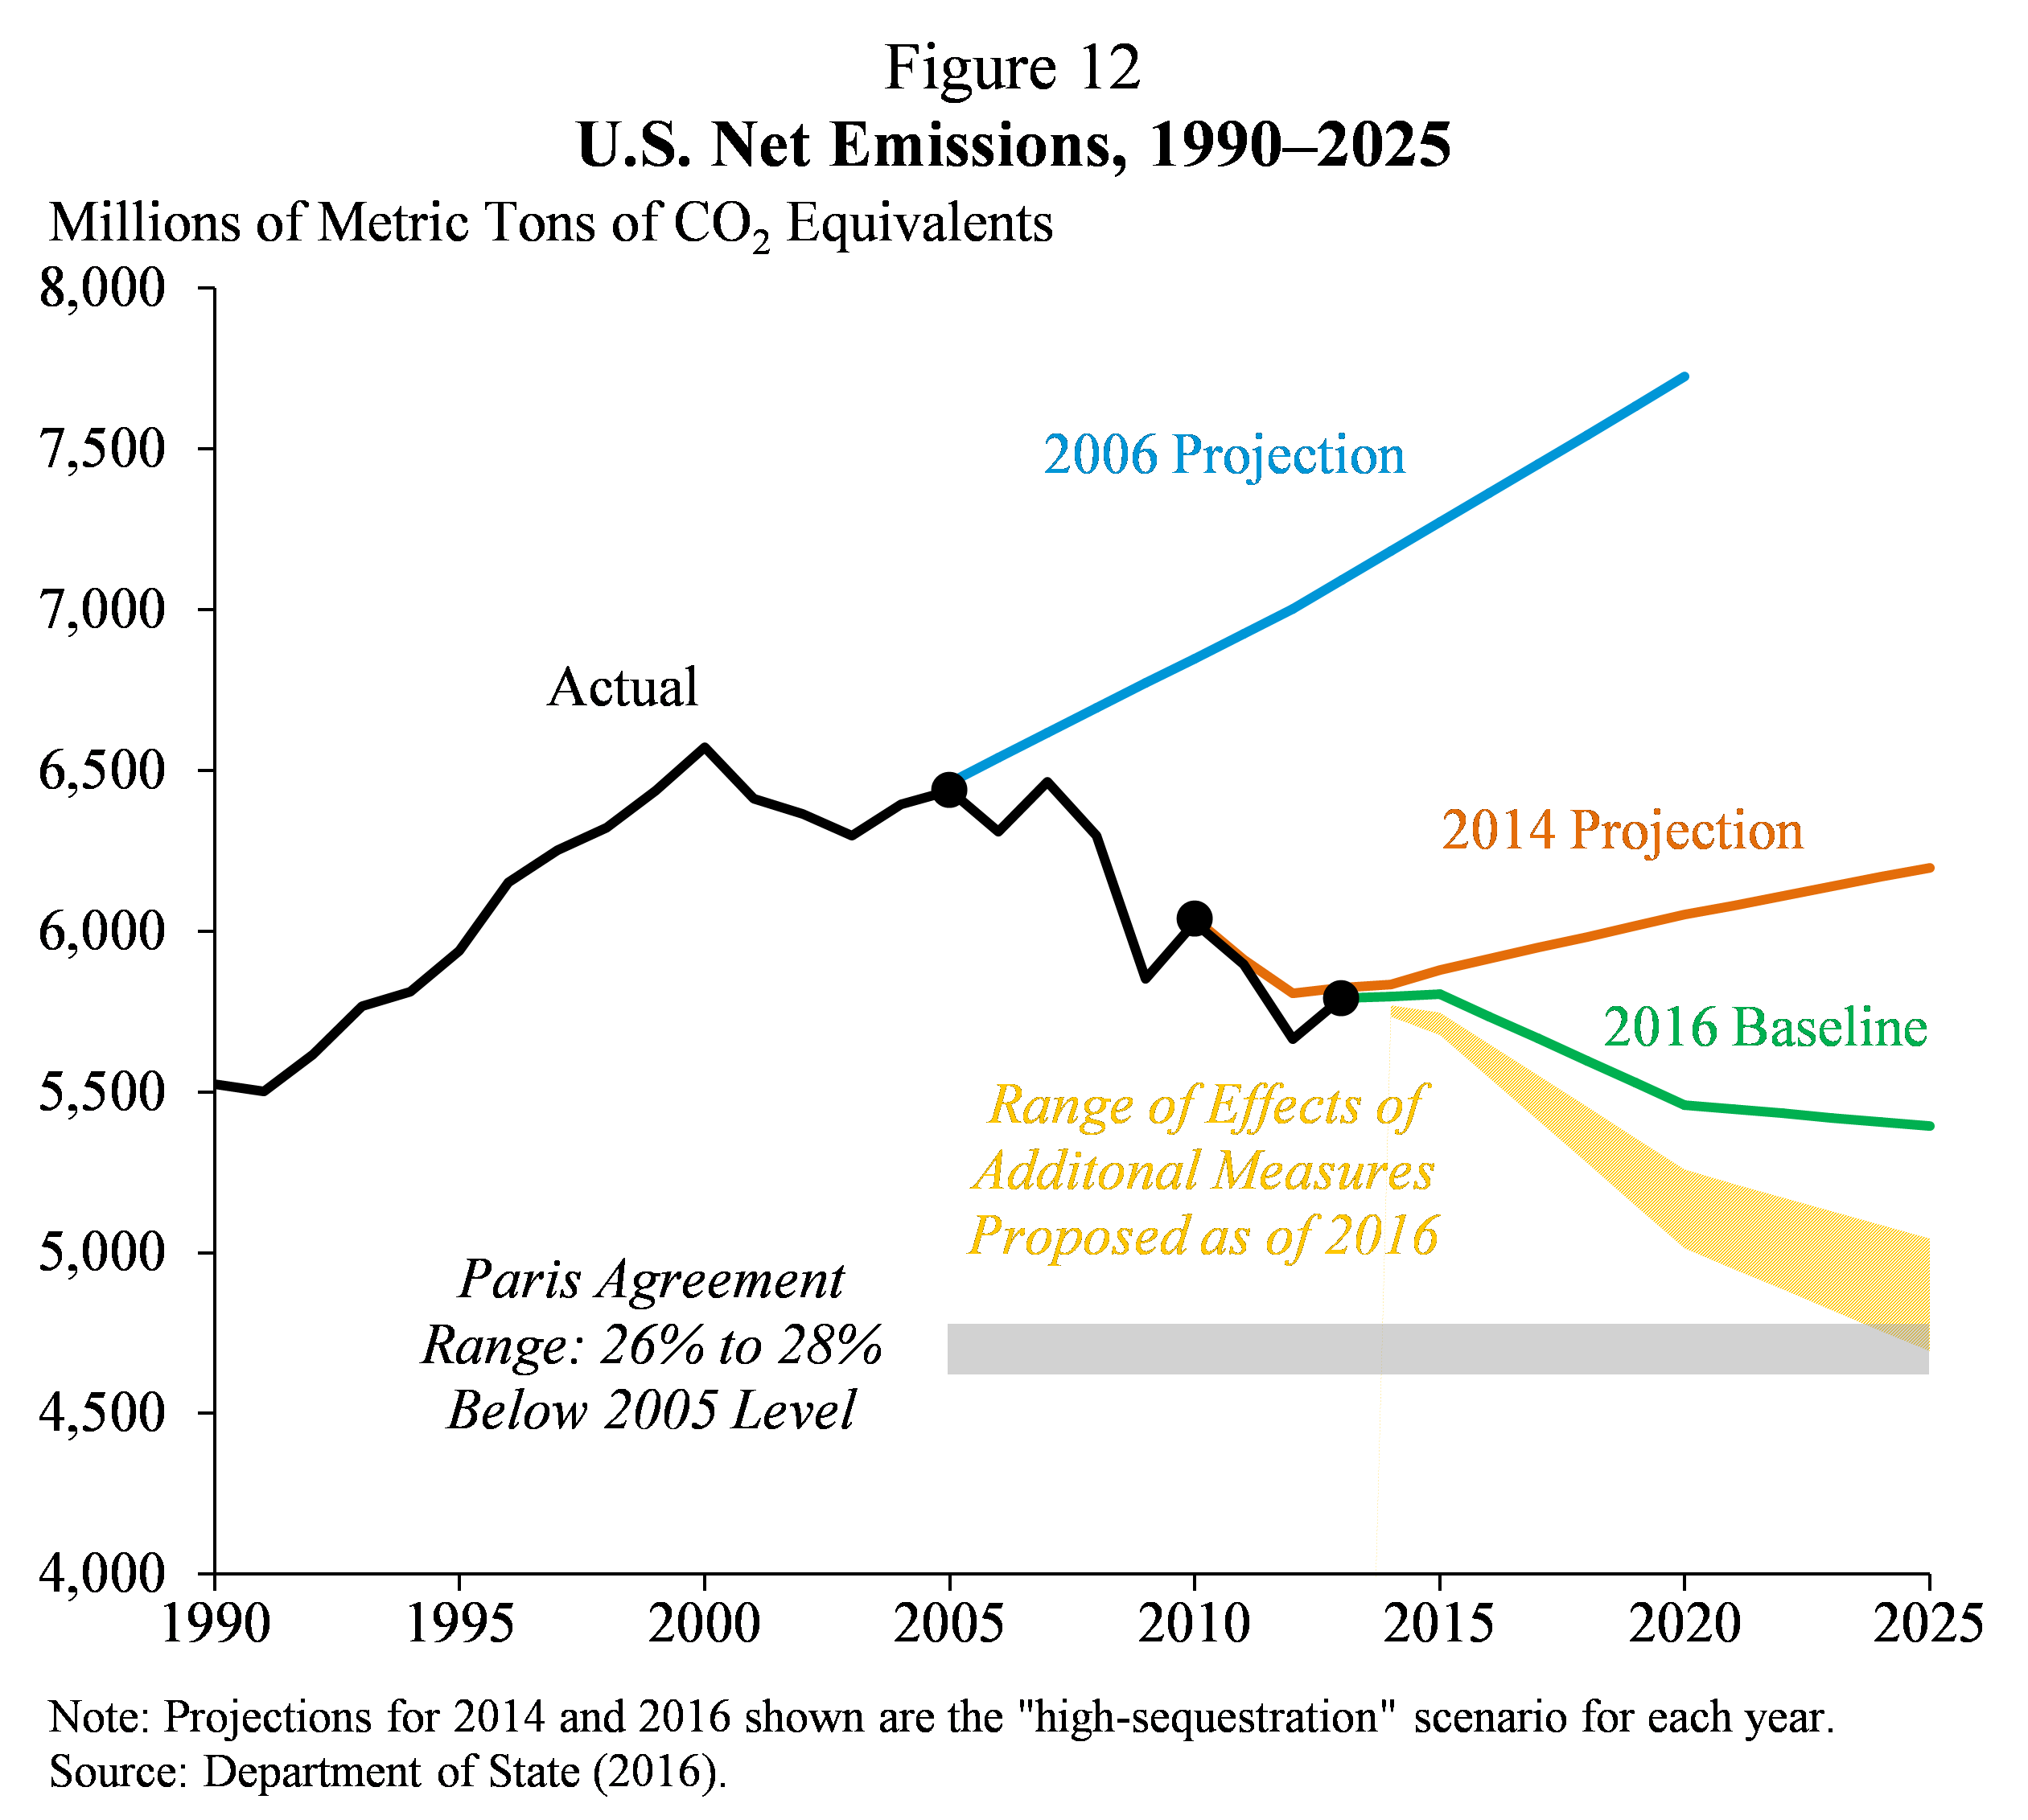
Finally, sustainable economic growth also requires addressing both the short- and long-run effects of climate change, which presents large risks not just to our environment but also to economic growth and fiscal sustainability. As discussed above, the Administration has taken ambitious steps to reduce carbon emissions and move toward a clean energy economy, including agreeing to reduce net emissions to between 26 and 28 percent of their 2005 level by 2025 in the historic Paris Agreement (Figure 12). But more work remains to ensure that the effects of manmade climate change do not endanger future prosperity. As President Obama has acknowledged, even as the Paris accord has established an enduring framework for confronting the climate crisis, its ambitious goals are not sufficient. More will need to be done to invent new technologies, generate energy from low-carbon sources, and reduce the energy and carbon intensity of our economy so that damage from climate change does not undermine the economy and living standards in the future. As the last eight years have demonstrated, efficient policies tailored to fight climate change can be implemented in ways that support, and do not hinder, economic growth.
Conclusion
Looking back at the progress we have made these past eight years, I am incredibly proud of the work that CEA, and the entire Administration, has done to get the U.S. economy back on a path to recovery and growth. Today, the economy is in strong shape, with a low unemployment rate, rising wages, strong consumer spending, and increased financial health for both businesses and households. Nevertheless, the economy has faced significant challenges over many decades, many of which have manifested themselves in the slowdown in income growth for the American middle class. These challenges do not have a single cause, and, likewise, do not have a single solution. We have made important progress in addressing these issues in the last eight years, but these challenges have developed for so long, and have grown so large, that it would be impossible to solve them in that span of time. For over 70 years, CEA has contributed to a broader process to help Presidents and Administrations understand the underlying economic facts, to help analyze the causes of these trends, and to help craft evidence-based responses to improve the economy.
But our work is not finished. In addition to the work that CEA has done to help contribute to the formulation and implementation of the President’s economic policies, I am also proud of the work we have done in a series of reports, speeches, op-eds and other communications to help draw attention to some of the remaining long-term challenges that the U.S. economy faces. We have advanced the analysis of the causes and consequences of everything from the decline in the rate of men participating in the labor force over the last century to the threats that reduced competition can pose to consumers, to workers, and to the economy itself. I believe this analysis has set a model for what evidence-based research can contribute to helping to set the policy agenda.