
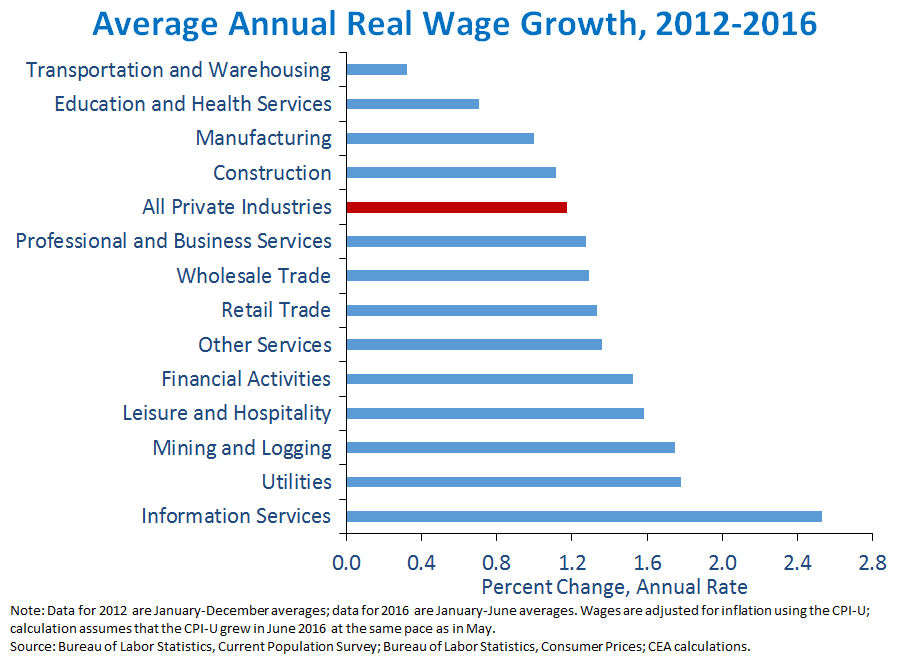
The economy added 287,000 jobs in June, a bounce-back from May’s low number and a clear indication that the economy continues to make solid progress. U.S. businesses have now added 14.8 million jobs since private-sector job growth turned positive in early 2010. So far in 2016, job growth has averaged a solid 172,000 jobs a month, well above the pace needed to maintain a low and stable unemployment rate. Meanwhile, the labor force participation rate ticked up in June, while part-time employment for economic reasons as a share of the labor force saw its largest one-month drop since 2010. Most importantly, average hourly earnings for private employees have increased 2.6 percent over the last twelve months, tied for the fastest twelve-month pace since the recovery began. Nevertheless, more work remains to sustain faster wage growth and to ensure that the benefits of the recovery are broadly shared, including investing in infrastructure and job training, implementing high-standards trade agreements like the Trans-Pacific Partnership, and raising the minimum wage.
FIVE KEY POINTS ON THE LABOR MARKET IN JUNE 2016
1. U.S. businesses have now added 14.8 million jobs since private-sector job growth turned positive in early 2010. Today, we learned that private employment rose by 265,000 jobs in June. Total nonfarm employment rose by 287,000 jobs in June, above the pace of recent months and well above the pace of about 80,000 jobs per month that CEA estimates is necessary to maintain a low and stable unemployment rate given the impact of the aging of the population on labor force participation. A small portion of the pickup in job growth in June was due to the end of a strike of 35,100 workers in the telecommunications industry that temporarily lowered job growth in May.
The unemployment rate increased to 4.9 percent in June, undoing part of May’s large decline, while the labor force participation rate ticked up and the broadest measure of labor underutilization, the U-6 rate, ticked down. Wage growth has picked up in recent months: over the last twelve months, average hourly earnings increased 2.6 percent (tied for the fastest twelve-month pace since the start of the recovery), and have grown at an annual rate of 2.8 percent so far in 2016.
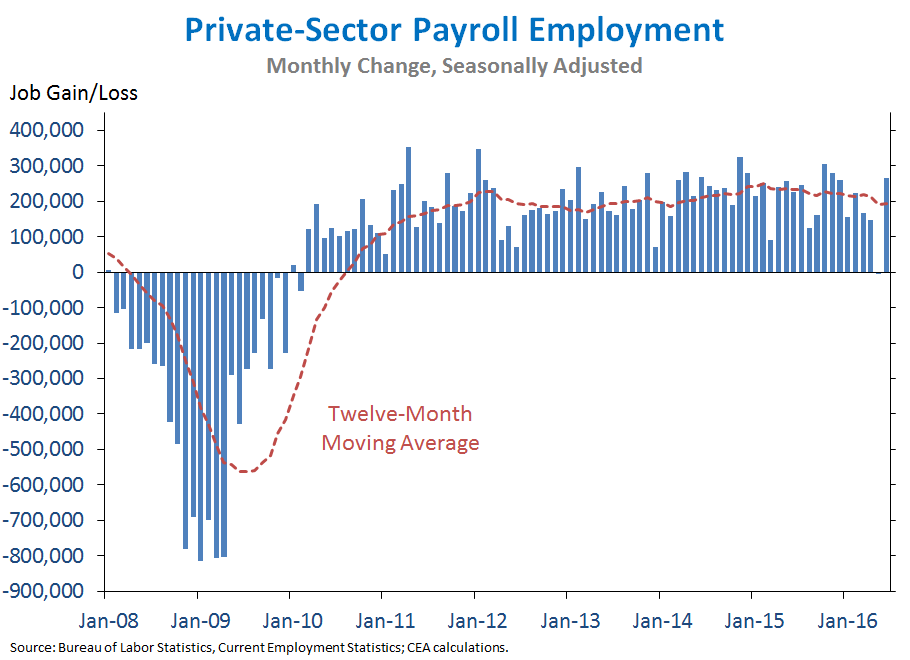
2. In recent years, estimates of monthly job growth have been less volatile than at any point on record, though an increase in volatility in recent months is a reminder of the importance of averaging over longer periods and looking at a range of data sources. The chart below shows a rolling 36-month standard deviation for the monthly change in payroll employment, a measure of volatility that shows how much the monthly values diverge from the average over the same period. Volatility in job growth is due to a combination of fluctuations in the underlying economy, as well as the imprecision of measuring monthly job changes, with the standard deviation of job growth tending to rise near turning points in the business cycle. In recent years, monthly job growth has been remarkably steady, with the standard deviation of monthly changes falling well below its level in any expansion period on record—part of a broader reduction in the volatility of high-frequency macroeconomic data. However, increased volatility in the last two months is a clear reminder of the importance of looking at data over longer periods—with May well below the recent pace of job growth, June well above the recent pace of job growth, and the longer-run average likely a more accurate reflection of continued strength in the U.S. economy.
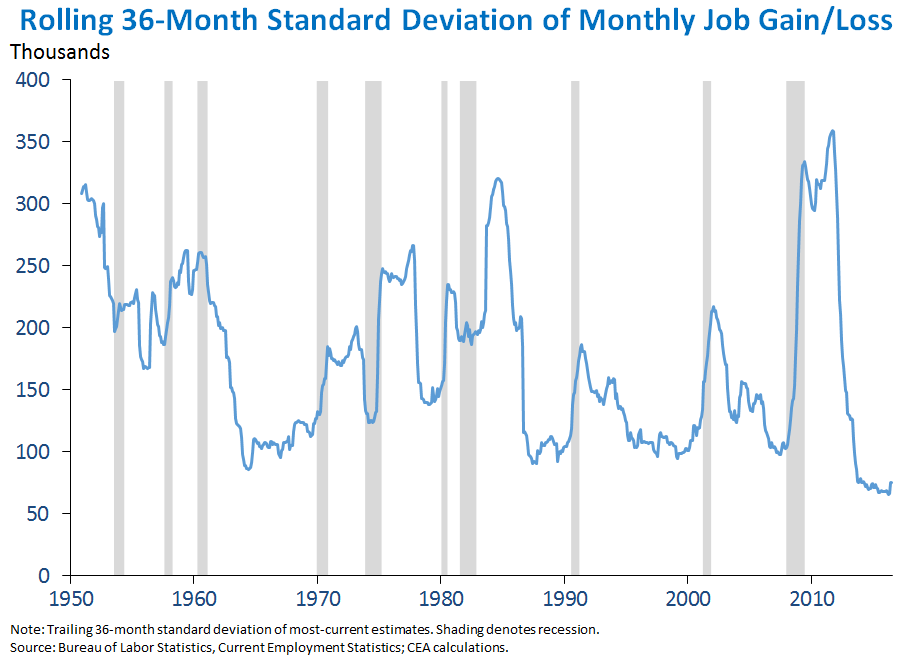
3. The labor force participation rate for men in their prime working years, which ticked up in June, has been roughly stable since 2012 but has been declining over the last six decades. As discussed in a recent CEA report, the labor force participation rate for prime-age men—those between the ages of 25 and 54—peaked at 98 percent in the 1950s, and has been falling for more than sixty years. This long-run decline has largely been concentrated among those with less education: while all groups of prime-age men have seen their labor force participation fall, the sharpest drop has been for those with a high school degree or less. As the chart below shows, participation rates by educational attainment, previously quite similar, have diverged since the 1960s. In 1964, 98 percent of prime-age men with a college degree or more participated in the workforce, compared to 97 percent of men with a high school degree or less. In 2015, the rate for college-educated men had fallen slightly to 94 percent, while the rate for men with a high school degree or less had plummeted to 83 percent.
CEA research suggests that decreased labor force participation among prime-age men is largely due to reductions in the demand for lower-skilled labor (rather than to reductions in its supply), since declining workforce participation for lower-skilled workers has coincided with a fall in their wages relative to higher-skilled workers. Moreover, the magnitude of the decline in the United States compared to other countries with similar demand shocks suggests that U.S. labor market institutions and policies have also played an important role. A number of policies detailed in the CEA report—including supporting aggregate demand in the economy, making labor markets more supportive of participation, and reforming the tax system to increase the returns to participation—would all help to boost prime-age male participation.
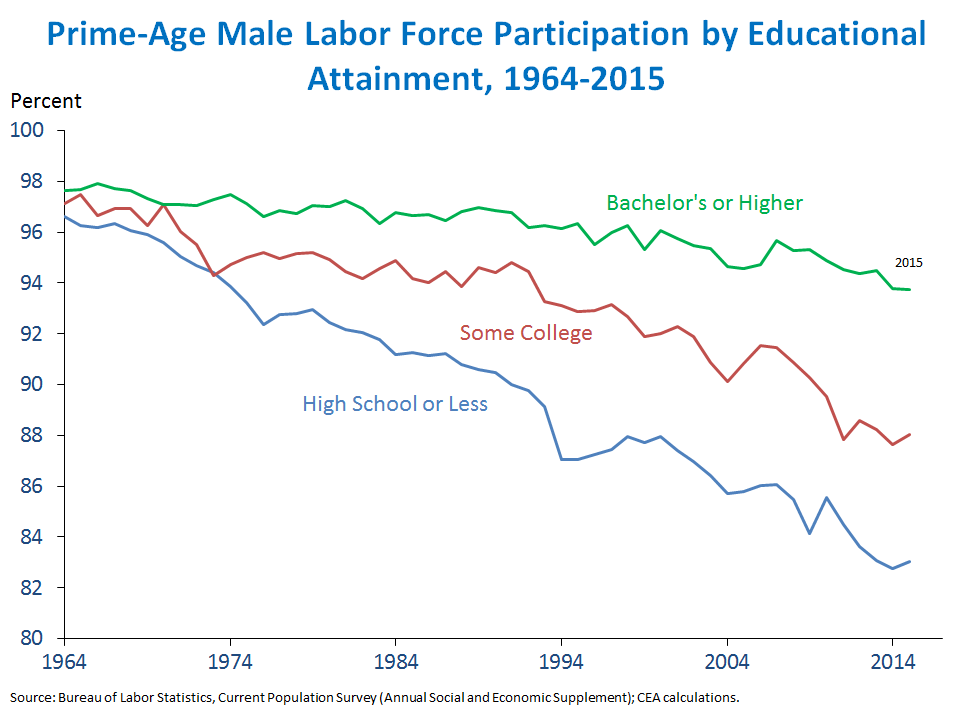
4. Gains in real average hourly earnings over the past three-and-a-half years have benefited workers across all major private industries. Over the past twelve months, nominal hourly earnings for all private-sector workers have increased 2.6 percent, while consumer prices have risen just 1.0 percent over the twelve months ending in May. Nominal hourly wages have generally been rising faster than inflation since mid-2012, translating into real wage gains for American workers. Between 2012 and the first half of 2016, real wages for all private workers grew at an average rate of 1.2 percent a year. However, this average masks considerable variation in real wage growth among workers in different industries. Among major industry groups, workers in information services have seen the fastest growth, with real earnings increasing at an average rate of 2.5 percent a year between 2012 and the first half of 2016. At the other end of the distribution, workers in the transportation and warehousing industry have seen the slowest real wage growth (0.3 percent a year). Nevertheless, as the chart below shows, workers in all major industries have seen real increases in their hourly earnings, though more work remains to promote faster wage growth for all Americans.
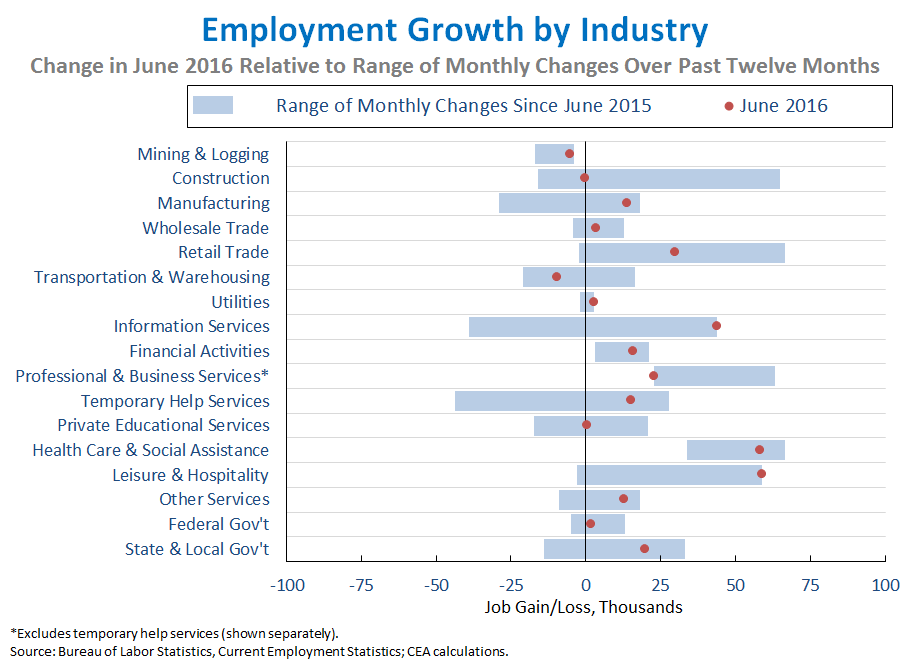
5. The distribution of job growth across industries in June was consistent with recent trends, though some sectors that have struggled recently saw better performance. Industries such as leisure and hospitality (+59,000) and utilities (+3,000) had their largest gains in the last twelve months in June. Information services did so as well, with an increase of 44,000 jobs due in part to the bounce-back from May’s strike in the telecommunications industry. On the other hand, several industries, including professional and business services (+23,000, excluding temporary help services), transportation and warehousing (-9,000), private educational services (+400), and construction (0) saw weaker-than-average growth. Manufacturing still faces global headwinds, but showed somewhat better growth in June (+14,000) compared to the past year, and mining and logging (which includes oil extraction) posted a smaller loss (-5,000) than in recent months. Across the 17 industries shown below, the correlation between the most recent one-month percent change and the average percent change over the last twelve months was 0.50, below the average correlation over the last two years.
As the Administration stresses every month, the monthly employment and unemployment figures can be volatile, and payroll employment estimates can be subject to substantial revision. Therefore, it is important not to read too much into any one monthly report, and it is informative to consider each report in the context of other data as they become available.


