
The robust pace of job growth continued in December as the unemployment rate held at its lowest level since April 2008 and labor force participation ticked up. Our economy has now added more jobs over the past two years than in any two-year period since 1998-2000. In fact, the annual average unemployment rate has seen its fastest two-year decline in thirty years. Most importantly, wages have risen faster over the past year than at any time since the recovery began. Nevertheless, we still have more work to do to drive further job creation and faster wage growth. That’s why the President will continue to push for policies including approving the Trans-Pacific Partnership to open our exports to new markets, investing further in infrastructure, and raising the minimum wage.
FIVE KEY POINTS ON THE LABOR MARKET IN DECEMBER 2015
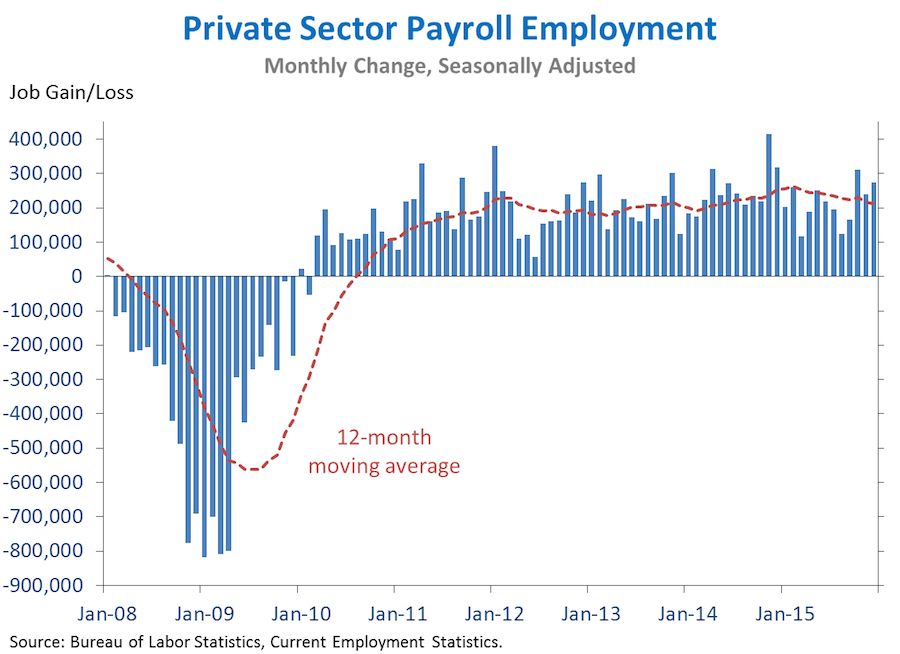
1. Our businesses have now added 14.1 million jobs over 70 straight months, extending the longest streak on record. Today we learned that private employment rose by 275,000 jobs in December, while private employment growth in October and November was revised up by a combined 51,000 jobs. The unemployment rate held steady at 5.0 percent in December while the labor force participation rate edged up to 62.6 percent. Average hourly earnings for all private employees have now risen 2.5 percent over the past year, the fastest pace since the recovery began. Overall, our businesses have added 5.6 million jobs over the past twenty-four months—the most in any two-year period since 1997-1999.
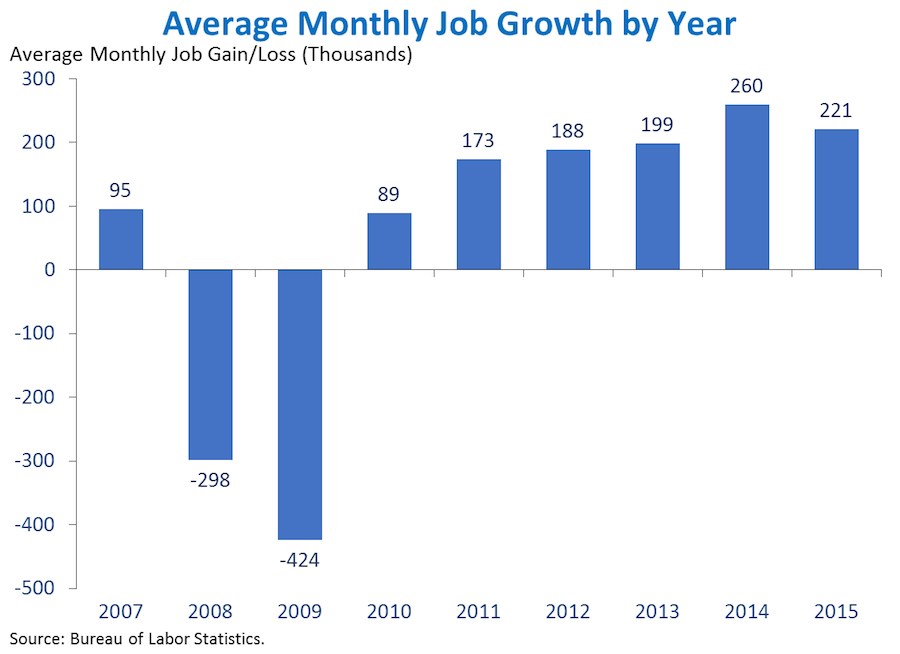
2. Our economy added 221,000 jobs per month on average over the course of 2015, continuing the strong labor market recovery. 2015 was the second-best year of job growth since 2000, extending the robust job gains observed earlier in the recovery. However, many of the global headwinds our economy faces—including the slowing foreign demand that weighed on our manufacturing sector and reduced oil and gas investment—contributed to a pace of job growth somewhat below that observed in 2014. In addition, as the strong recovery brings our economy closer to full employment, job growth will likely moderate. This effect may also have contributed to the lower pace of employment growth in 2015 compared with 2014.
Going forward, our aging population will continue placing downward pressure on the labor force participation rate, further reducing the pace of job growth necessary to keep the unemployment rate constant. In fact, CEA estimates the break-even rate of employment growth—the rate needed to maintain a constant unemployment rate over the next year if the labor force participation rate moves in line with demographic trends—at only 77,000 jobs per month. Of course, there is still more room for the labor market to improve—especially with respect to faster wage growth. But as the unemployment rate normalizes, the pace of job growth would be expected to start normalizing as well.
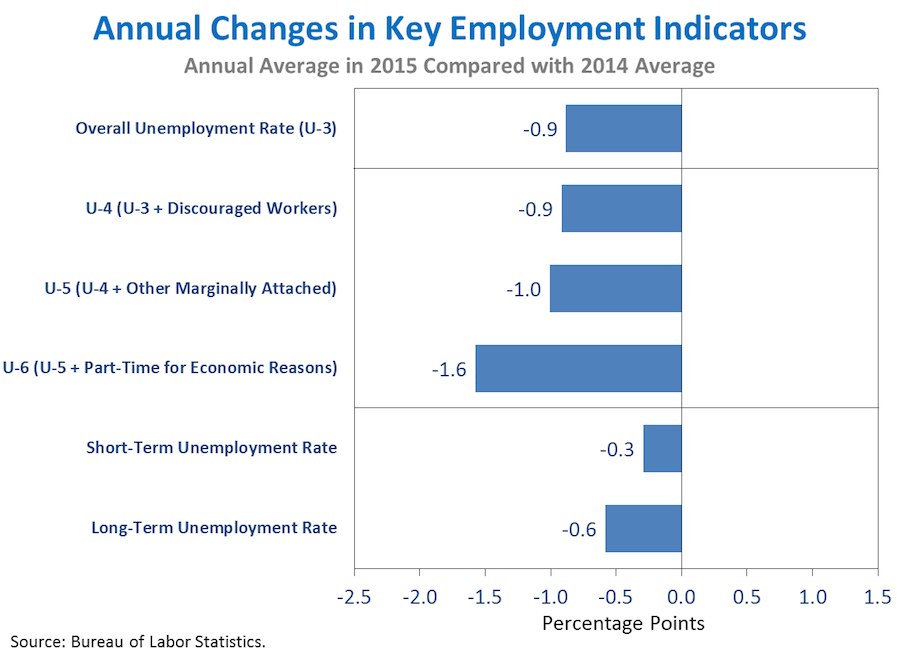
3. The annual average unemployment rate declined 0.9 percentage point between 2014 and 2015. This is consistent with a range of indicators from the Bureau of Labor Statistics (BLS) household survey that show the labor market strengthened considerably in 2015. In particular, the broader measures of labor underutilization published by the Bureau of Labor Statistics—including some people who have withdrawn from the labor force or who are working part-time for economic reasons—fell faster than the official unemployment rate in 2015. Additionally, declining long-term unemployment accounted for about two-thirds of the decline in the overall unemployment rate in 2015, a disproportionate share given that less than one-third of the jobless are long-term unemployed. The labor force participation rate ticked down in 2015 as the baby boomers continued to retire. But despite this demographic trend, the strong pace of job growth over the past year drove an uptick in the share of the population that is currently employed.
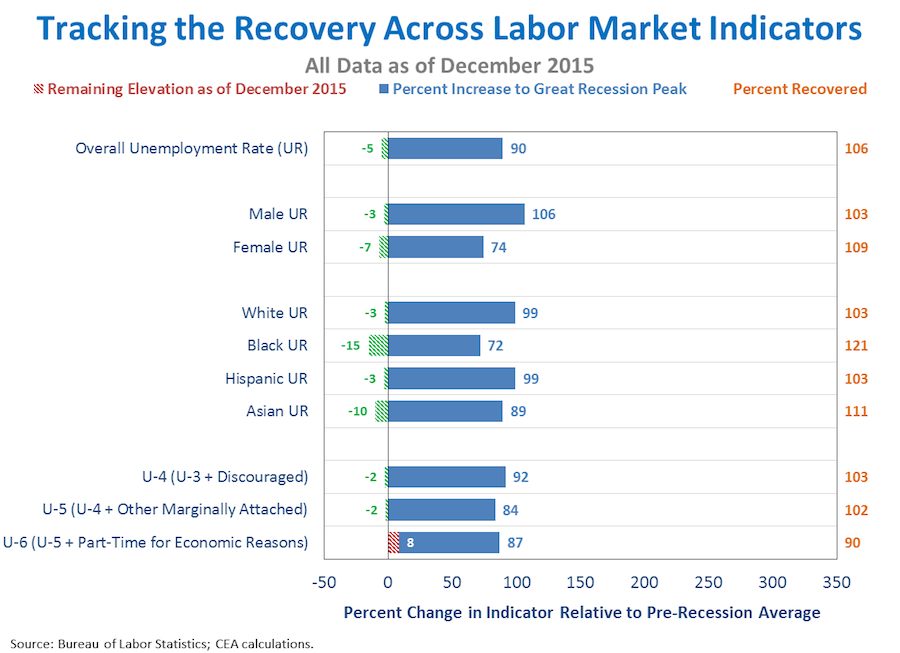
4. The unemployment rate has fully recovered to its pre-recession average for many demographic groups, although the broadest measure of labor market slack remains slightly elevated. The unemployment rate is fully recovered for both genders and across all racial and ethnic groups reported by BLS. In particular, the African-American unemployment rate is at its lowest level since September 2007, 15 percent below its pre-recession average. The unemployment rate for women is at its lowest level since April 2008, 7 percent below its pre-recession average. Like all labor market indicators unemployment rates for particular demographics tend to be volatile, and it is important to focus on long-term trends in these and other data.
Despite the broad-based recovery, the broadest measure of slack—the “underemployment rate,” or U-6, which includes discouraged workers, those marginally attached to the labor force, and those working part-time for economic reasons—is 90 percent recovered but remains somewhat elevated. Such data indicate that more work remains before the labor market is fully recovered.
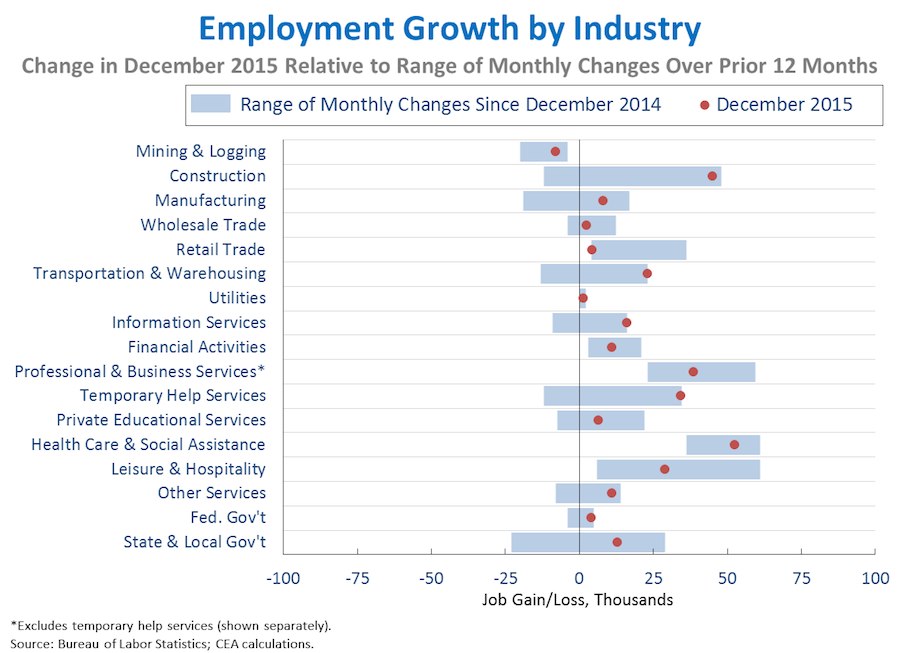
5. December was a strong month for employment growth in most sectors, although global headwinds continue to restrain job growth in certain industries. Especially strong gains relative to the past year were seen in industries such as transportation and warehousing (+23,000), information services (+16,000), and construction (+45,000). Manufacturing (+8,000) also had a stronger-than-average month, although slowing foreign demand continues to weigh on growth in that sector relative to 2014. Mining and logging employment, which includes oil extraction, continued to decline (-8,000) as low oil prices have slowed investment. Across the 17 industries shown below, the correlation between the most recent one-month percent change and the average percent change over the last twelve months was 0.82, somewhat above the average correlation over the previous three years.
As the Administration stresses every month, the monthly employment and unemployment figures can be volatile, and payroll employment estimates can be subject to substantial revision. Therefore, it is important not to read too much into any one monthly report, and it is informative to consider each report in the context of other data as they become available.


