Recovery Act Fourth Quarterly Report - Evidence of Economic Impact of the Recovery Act
EVIDENCE OF THE ECONOMIC IMPACT OF THE RECOVERY ACT
In this section, we consider a range of ways of estimating the overall impact of the Recovery Act. We begin with a straightforward examination of the behavior of GDP and employment, and then move on to more sophisticated analyses using an economic model, a statistical forecasting exercise, and the direct reporting data. Although none of these approaches is definitive, together they provide considerable evidence that the Recovery Act has played a critical role in moving the economy from accelerating decline to recovery.
A. The Change in the Economy’s Trajectory
The first way that we investigate the impact of the Recovery Act is to consider the behavior of real GDP and employment. Are the changes that we have observed in these two key indicators over the past year consistent with the Act having substantial effects?
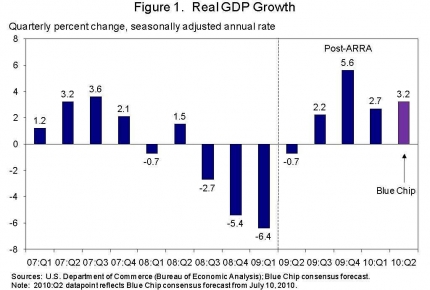
Figure 1 shows the growth rate of real GDP. The dashed line between the first and second quarters of 2009 separates the period before the Recovery Act (which was signed February 17, 2009) could have had a significant impact on the economy from the period after. GDP fell progressively more rapidly from the third quarter of 2008 to the first quarter of 2009, but then began to reverse course quickly after the passage of the Recovery Act. After declining at an annual rate of 6.4 percent in the first quarter of 2009, GDP fell at a rate of 0.7 percent in the second quarter, and then rose at a rate of 2.2 percent in the third quarter and 5.6 percent in the fourth. The improvement in growth of 12 percentage points from the first quarter to the fourth (that is, the swing from growth at a -6.4 percent rate to growth at a 5.6 percent rate) was the largest over any three quarters since 1981, and the second largest since 1958.
After the extremely rapid growth at the end of 2009, growth moderated to 2.7 percent in the first quarter of 2010, as the influence of changes in inventory investment moderated considerably. Figure 1 also shows the July 10 Blue Chip consensus forecast for real GDP growth in the second quarter of 2010. That forecast is 3.2 percent, indicating that forecasters believe that the solid growth in the first quarter continued in the second (Blue Chip Economic Indicators, 2010). Importantly, real GDP growth is expected to remain steady in the second half of 2010 and throughout 2011. The first official GDP estimate for 2010:Q2 will be released on July 30.
Figure 2 presents the behavior of the change in payroll employment. Employment shows the same pattern of an accelerating decline reversing course rapidly after the Recovery Act was passed. In the first quarter of 2009, the economy lost on average an astounding 756,000 jobs per month. Job losses fell to 476,000 per month in the second quarter, 261,000 per month in the third, and 92,000 in the fourth. The economy began adding jobs in 2010, with average gains of 63,000 per month in the first quarter and 123,000 per month in the second quarter.4 The change in the average monthly change in employment over the past five quarters was among the largest on record.

The economy is obviously still far from healthy. Real GDP is substantially below its normal path, and the unemployment rate remains at 9.5 percent. While job growth has averaged 123,000 per month over the past quarter, more robust growth is needed to bring down the unemployment rate quickly. But the change in the economy over the last 18 months has been dramatic. Given what we now know about the frightening momentum of economic decline in the first quarter of 2009, the change in the trajectory is all the more remarkable.
The timing of the change in trajectory is highly suggestive of an important role for the Recovery Act. At the time the Act was passed, the economy was in freefall. Real output stabilized dramatically in the quarter after the Act was passed, and began growing again in the next quarter. Similarly, job losses began to moderate rapidly in the quarter after the Act was passed, continued to slow greatly in the subsequent two quarters, and turned to modest job gains early in 2010.
B. Estimates of Effects from an Economic Model
Methodology
A key way that the CEA estimates the effects of the Recovery Act on GDP and employment is to use existing estimates of the macroeconomic effects of fiscal policy. That is, one can use mainstream estimates of economic multipliers for the effects of fiscal stimulus. The version of the approach that we use here is identical to that used in the CEA’s previous quarterly reports on the Recovery Act. 5
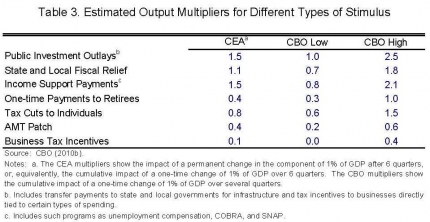
In its recent reports on the impact of the Recovery Act, CBO uses a similar approach. CBO reports high and low estimates for the multipliers associated with different types of spending (CBO, 2010b). Table 3 shows how the CEA multipliers compare with the CBO estimates. The CEA multipliers show the impact of a change in the fiscal component on GDP after six quarters. The comparison shows that our multiplier estimates are consistently in the middle of the CBO range, and typically toward the lower end. This reflects the fact that our multipliers were chosen to reflect as much as possible the professional consensus.
The CEA model will obviously not yield exact figures for the effects of the Recovery Act. To begin with, there is uncertainty about the size of the economic effects of a “typical” increase in public investment outlays or a “typical” tax cut. There is even more uncertainty about the precise timing of those effects, and modest changes in timing have noticeable effects on the impact at a specific point in time. In addition, the current exceptional economic environment could make the effects of stimulus somewhat larger or smaller than normal, or could cause them to occur somewhat more or less quickly. Finally, the Recovery Act -- appropriately -- was not just typical stimulus. For types of stimulus that are used less frequently, there is even greater uncertainty about the size and timing of the macroeconomic effects.
As in the earlier reports, we use figures on actual outlays and tax relief under the Recovery Act. Since CEA’s third quarterly report, the Office of Tax Analysis of the Department of the Treasury has prepared revised estimates of the magnitude and timing of the tax provisions of the Recovery Act incorporating actual tax return data for 2009. These revised estimates have led to minor revisions in our estimates of the impact of the Recovery Act in previous quarters.
Results
The results of this analysis are shown in Table 4. They imply that the Recovery Act is having a substantial beneficial effect on production and employment. Specifically, they indicate that the Recovery Act raised the level of real GDP in the second quarter of 2010, relative to what it otherwise would have been, by 2.7 percent. This approach also indicates that the Act increased employment relative to what it otherwise would have been by 2.5 million as of 2010:Q2.6
C. Estimates of Effects from Comparison to a Statistical Baseline Forecast
Methodology
An entirely different approach to estimating the effects of the Recovery Act is to compare the actual paths of GDP and employment with the predictions of a sensible statistical forecast of their usual behavior. This approach has two important advantages relative to the model-based approach. The most obvious one is that because the approach is purely statistical, it does not depend on estimates of multipliers based on past history.
The approach’s other key advantage is that it can capture factors that might have caused fiscal policy to have unusual effects in the exceptional economic circumstances that prevailed when the Act was passed. For example, the Act, by stabilizing the economy and restoring confidence, may have played a role in healing the financial sector and jump-starting private demand. Because fiscal policy does not usually have such effects under normal conditions, they would not be captured by conventional multiplier estimates. But they would be reflected in a comparison of the path the economy followed after passage of the Act with the trajectory it was on.
The disadvantage of this approach is that the comparison will reflect not just the impact of fiscal policy, but all other unusual influences on the economy following passage of the Act. Most obviously, other policy actions, such as the Financial Stability Plan, monetary policy, and the Federal Reserve’s program of buying agency debt and long-term U.S. government bonds, contributed to the economic turnaround. More generally, any other factors not captured by the past history of GDP and employment, such as unusual moves in foreign demand or asset prices, would also be captured in the difference.
The overall effect of the policies other than the Recovery Act and non-policy factors on GDP and employment could be either positive or negative. For example, while the various actions to improve financial conditions have surely had a positive impact, the continuing stringency in credit conditions is most likely restraining GDP and employment relative to their usual cyclical patterns. Thus, the forecast residuals could either overestimate or underestimate the impact of the Recovery Act.
Equally important, the estimates from this approach have considerable margins of error. At any time, the economy is subject to many influences that are not reflected in the past behavior of GDP and employment. These influences may be particularly large in a period as turbulent as the past eighteen months. And, the longer the time that has passed, the larger the role of those disturbances is likely to be. As a result, the estimates from this approach are likely to be less reliable as more time elapses, and should be viewed only as rough guides to the effects of the Recovery Act.
There are many ways to construct a statistical baseline forecast. The particular approach that we use is identical to that in previous CEA reports on the Recovery Act. We estimate a vector autoregression (or VAR) using the logarithms of real GDP (in billions of chained 2005 dollars) and employment (in thousands, in the final month of the quarter) over the period 1990:Q1–2007:Q4. We include four lags of each variable. Because the estimation ends in 2007:Q4, the coefficient estimates used in the prediction are not influenced by developments in the current recession. Rather, they show the usual joint short-run dynamics of the two series over an extended sample. We then forecast GDP and employment beginning in the second quarter of 2009 using actual data through the first quarter of 2009. Data through the first quarter include the monetary response to the current crisis, but not the fiscal stimulus or other actions that took effect after the first quarter. We have experimented with a variety of other ways of projecting the no-stimulus path of GDP and employment. The results of those exercises are similar to those we report below.
Results
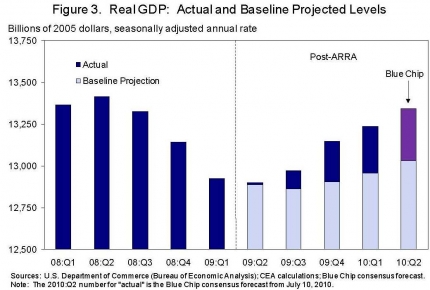
Figure 3 shows the results of this forecasting exercise for GDP, together with the actual path of GDP. Past history would have led one to expect GDP to continue to decline in the second and third quarters of 2009 before beginning to grow moderately in the fourth quarter. The figure shows that actual GDP has risen steadily above the forecast path. It was 0.7 percent above that path in 2009:Q2, 1.4 percent above in 2009:Q3, 2.5 percent above in 2009:Q4, and 2.9 percent above in 2010:Q1. The Blue Chip forecast of 3.2 percent growth in 2010:Q2 suggests that the gap between the actual (as measured by Blue Chip) and projected levels of GDP in 2010:Q2 was about 3.2 percent.7
Table 5 summarizes the difference between the actual and forecasted paths of GDP using the statistical projection methodology.
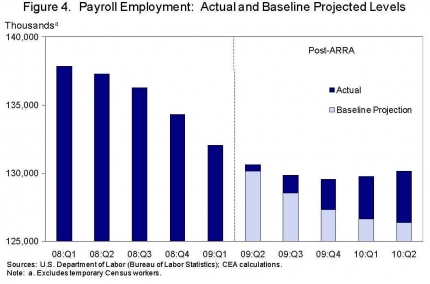
Figure 4 shows the results for employment. Because employment growth normally changes relatively slowly, the usual historical patterns would have led one to expect employment losses to moderate only slowly over the course of 2009 and to continue through the middle of 2010. Actual employment losses moderated much more rapidly. As a result, employment was about 300,000 above the forecast path as of the middle of 2009:Q2, 1.1 million above as of the middle of 2009:Q3, 1.9 million above as of the middle of 2009:Q4, 2.8 million above as of the middle of 2010:Q1, and 3.6 million above as of the middle of 2010:Q2.8 These results are also summarized in Table 5.
The projection methodology used here shows that using the past history of GDP and employment and actual data through 2009:Q1, one would have predicted that GDP in the second quarter of 2010 would be about 3.2 percent lower than it actually was, and that employment would be about 3.6 million lower than it actually was.
D. Evidence of Effects from Recipient Reporting
One hallmark of the Recovery Act has been an unprecedented commitment to providing timely, transparent, and accountable information about the Act’s progress, allowing the public to “follow the dollar” as it is spent. In pursuit of this goal, the Act requires every prime recipient of Recovery Act funds subject to Section 1512 of the Act to file quarterly reports on the employment effects of the Act. The recipient reports are designed to reflect an estimate of individual, identifiable jobs and to provide a source of independent evidence of the effects of the Recovery Act.
Section 1512 of the Recovery Act requires prime recipients of Recovery Act funds for “projects and activities” to file quarterly reports. It is obviously not possible to identify specific jobs associated with the Recovery Act for the types of stimulus, such as individual tax cuts and extended unemployment insurance benefits, that support spending on a broad range of goods and services produced by a wide range of firms. Largely for that reason, there are no recipient reports associated with the components of the Recovery Act that consist of tax reductions, including the Making Work Pay tax credit, and with many categories of spending, including unemployment insurance benefits and aid to states under the temporary Medicaid FMAP increase. Altogether, funds subject to the recipient reporting requirement comprise about one-third of the total funding of the Act.
There have now been three rounds of recipient reports. The first reports were filed in October 2009 and described activity from the passage of the Act through September 30, 2009. The second reports were filed in January 2010 and covered the period between October 1 and December 31, 2009. In response to feedback from recipients and data users after the first round, the reporting requirements were changed slightly for the second round. The initial instructions asked recipients to make complex judgments about whether a job would have been filled “but for” funding under the Recovery Act. The instructions for the second reports simply asked recipients to report jobs funded by Recovery Act funds in 2009:Q4, without trying to assess whether the jobs would have existed or not in the absence of the Act. The third set of reports, covering 2010:Q1, were filed in April 2010. The fourth set of reports are being filed this month.
Table 6 shows the jobs reported by recipients for the three quarters for which there are reports. In the first quarter of 2010, recipients reported that nearly 700,000 jobs were funded by the Recovery Act.

As described in the CEA’s second quarterly report, there are many reasons that the figures from the recipient reporting data do not provide a comprehensive or exact accounting of the jobs created or saved by the Recovery Act (CEA, 2010a, pp. 29-31). One key reason has already been mentioned: the reporting requirements will only apply to about one-third of the overall funding under the Act. Moreover, for the stimulus that has occurred thus far, the fraction is even smaller. The direct spending components of the Act, which are the main ones subject to the reporting requirements, are, as expected, spending out over a longer time horizon than other components and playing an important role in providing support to the economy over an extended period. As a result, spending subject to the reporting requirements has been only a relatively small fraction of the total stimulus so far.
Table 7 shows obligations, outlays, and tax reductions in each quarter for both the Recovery Act as a whole and for the subset of programs subject to recipient reporting requirements. The fraction of the stimulus -- outlays and tax cuts -- covered by the recipient reports has generally been around 20 percent.
Although the recipient reporting data cannot be used directly to determine the overall impact of the Recovery Act on employment, the data provide a useful check on the estimates from the aggregate approaches described in Sections III.B and III.C. One simple way to perform such a check is to note that while the funds subject to the reporting requirements have been only about 20 percent of the overall stimulus under the Act, the jobs figures from the recipient reports for each quarter are substantially more than 20 percent of the corresponding estimates from the model and projection approaches. For example, for 2010:Q1 (the most recent quarter for which there are recipient reports), only 17 percent of stimulus was subject to recipient reporting requirements. Yet the 682,000 jobs reported in the recipient reports are 31 percent of the estimated overall jobs effects from the model approach and 24 percent of the overall estimate of the projection approach. Thus, this comparison suggests that the jobs estimates from the aggregate approaches are, if anything, somewhat low.
In the case of the model approach, we can improve on this simple comparison by asking what the approach implies about the jobs impact not from all of the Recovery Act, but only from an amount of government spending equal to the amount subject to the recipient reporting requirement. Further, we can adjust the multipliers used in the model to omit the estimates of jobs created by the additional spending by the workers who are employed on the projects (which are obviously not included in the recipient reports); this brings the multiplier-based estimates closer to what the recipients were asked to report. This comparison again yields a considerably smaller estimate from the model approach than from the recipient reporting data for each quarter for which there are recipient reports. For 2010:Q1, for example, the model approach implies about 500,000 jobs due directly to the spending subject to reporting requirements, as opposed to the 682,000 jobs actually reported. Thus, this comparison again suggests that the model is not overstating the jobs effects.
In short, the recipient reports support the view that the ARRA has had a large, rapid impact on employment. Indeed, the recipient reports not only reinforce the reliability of the broader estimates produced by the CEA’s statistical and economic models, they suggest that these models could be understating the jobs impact of the Recovery Act.
E. Comparison with Other Estimates of the Effects of the Recovery Act
Many other economists and forecasters have estimated the likely effects of the Recovery Act. Most of those estimates are based on formal macroeconomic models. These estimates serve as a check of the reasonableness of our own estimates.
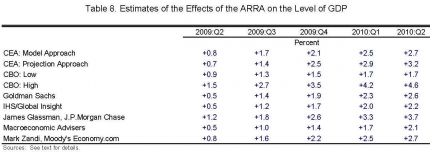
Table 8 reports estimates of the contribution of the Recovery Act to GDP since the Act was passed from an array of public and private forecasters.9 The first row repeats the model-based estimates from Section III.B, and the second row shows the estimates from Section III.C based on the comparison of actual outcomes with projections of the normal evolution of the economy. The next two rows show the low and high estimates prepared by the Congressional Budget Office. The estimates from both of our approaches are well below the top of the CBO range, and are generally in its lower part. The remaining lines of the table show the private sector estimates that we have been able to gather. These estimates are generally similar to ours.
Fewer estimates of the employment effects of the Recovery Act are available. Those that we have been able to gather are reported in Table 9, together with the estimates from our two approaches.10 The CEA model-based estimates are well within the range of the other estimates, though the figures for 2010:Q1 and 2010:Q2 are toward the high end. To the degree that the estimated employment effects from our model approach are somewhat larger than those of some other forecasters, it is useful to note that our estimate is based on the most recent spending and tax reduction data, whereas some of the private sector estimates have not been updated in many months. Also, our employment effect is derived from the GDP effect using standard estimates of the usual relationship between the two series. That our GDP estimate is squarely in the middle of the range of other GDP estimates therefore adds credence to our employment estimate.

The CEA employment estimates based on the projection approach, in contrast, are above the range of other estimates for the past two quarters. This difference reflects two facts. First, the other estimates are largely based on economic models similar to that used in the CEA’s model approach. Second, the turnaround of employment has been faster than one would have expected given the behavior of the economy before the passage of the Recovery Act and standard estimates of the effects of stimulus. Thus, an approach that takes into account the actual behavior of employment tends to yield higher estimates than ones that rely on a historical multiplier approach.
In light of the actual behavior of GDP, the estimates in Table 8 suggest that most forecasters believe that in the absence of the Act, GDP would have declined sharply in 2009:Q2 and continued to decline in 2009:Q3, and that growth would have been considerably weaker in the subsequent three quarters than it actually was. Likewise, the estimates in Table 9 imply that most forecasters believe that jobs losses would have moderated much more slowly than they actually did over the course of 2009, and that substantial job losses would have continued into 2010.
Continue to IV. The Public Investment Provisions of the Recovery Act.
4 These figures exclude temporary workers hired for the decennial Census.
5 See Council of Economic Advisers (2009b, p. 23) for more details.
6 The appendix of this report provides a breakdown of the estimated employment effects by state.
7 These differences in the actual and projected levels of GDP imply substantial differences in the growth rates of GDP. Specifically, they imply that GDP growth in 2009:Q2 was 2.8 percentage points higher than the baseline projected growth; in 2009:Q3 it was 2.9 percentage points higher; in 2009:Q4 it was 4.4 percentage points higher; in 2010:Q1 it was 1.4 percentage points higher; and in 2010:Q2 it was 1.4 percentage points higher.
8 Again, these figures exclude temporary Census workers.
9 The sources are as follows. CBO: CBO (2010b). Goldman Sachs: described in Goldman Sachs (2009); updated figures from Alec Phillips, email communication, April 7, 2010. IHS/Global Insight: figures from Gregory Dago, email communication, July 1, 2010. James Glassman, J.P.Morgan Chase: Glassman (2010). Macroeconomic Advisers: Macroeconomic Advisers (2009a, 2009b); exact figures from email communication, August 10, 2009. Moody’s economy.com: described in Zandi (2010); exact figures from Mark Zandi, email communication, June 24, 2010. Before using estimates from sources used in our earlier reports, we checked with each forecaster to ensure that their estimates of the effects of the Act had not changed.
10 The sources are the same as for Table 8.

